For those of us who are Python users, I would like to highlight a new tool called PyQSPICE. It works with QSPICE’s command-line interface to load QSPICE simulation results into memory for plotting in Python.
This is an open-source project hosted on GitHub. It is not supported by the QSPICE team.
The main module has an explanation in front of each method.
Q:: How to tweak a parameter, run a sim and repeat/loop?
A:: This example is running 2 sims from one next list by changing the netlist “.cir” file with Python regular expression “re” module.
Q:: Why “SJIS” encoding, in the Python module?
A:: See this discussion. The QSPICE uses “Latin-1 Supplement” and many file-encoding judgement routines (checked a couple of standalone encoding detection programs) think it “Shift JIS”, with a probability view point. Just to avoid Python error message, I use the “SJIS” encoding and I know I’m dealing with a file of “Latin-1 Supplement”.
PyQSPICE is very good and I have used it already.
How do I print the dc operating points if I am using PyQSPICE?? I do not see that function in the PyQSPICE class and was hoping if you could please help with that? It will be a good starting point to see dc operating points of all nodes (and currents)
before the PSRR circuit is simulated (or any other AC sim is triggered)
I run a quick trial and I see PyQSPICE can support your “.OP” needs.
I’m on the road and please wait for me next week
I’ll delete this post when I update PyQSPICE for the “.OP”, by replacing my post with the detail how to handle “.OP” on PyQSPICE.
I believe I made an over commitment, it’s the Thanks-Giving week here in USA…Within Nov, I’ll try to get it updated for “.OP”.
thank you masashi! I look forward to your uprate on how to use .op within PyQSPICE and getting a text file with outputs printed for the operating point (just like what one can see in the terminal).
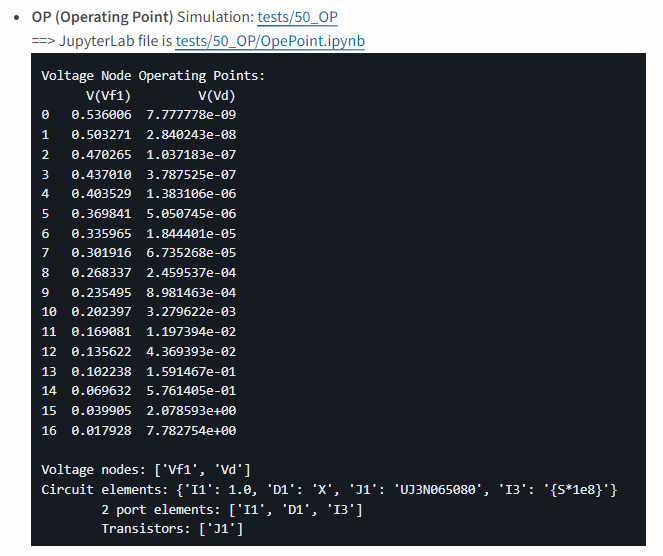
It supports .OP result reading. To make this happens, PyQSPICE now reads “.cir” netlist and extract nodes and elements. Not all elements implemented (logic gates, AD/DA converters), voltage nodes completely sandwiched by those elements will be ignored…for now.
Plot setting lines are consolidated into a method and now we can make our main code clean.
Only the code of “tests/50_OP” is clean for plotting, will update older “tests” examples step-by-step.
The example “tests/50_OP” is showing simple results but it is reading more info from the “.OP” run. Please try “print(df)” to see all the info this new version PyQSPICE reading.
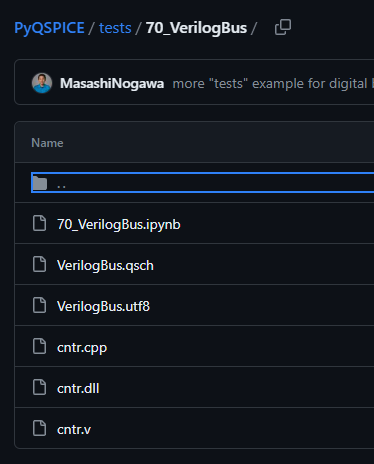
Can you plot signal buses that out be in the form of out[3:0]? I having been playing with the verilog functionality in qspice and not seeing a nice way to display buses in qspice. The ability to display buses in a similar way as modelsim would be nice that could interpret buses in decimal, binary or hex
Interesting subject. As I love software programming, I want to do something here (but no promise ).
May I ask couple of questions.
Do you want to have a waveform browser of zoom in/out, adding/deleting waveforms?
In another word, do you want an advanced GUI waveform viewing software?
Or, is it OK to plot a range of waveform you can specify in your Python code?
I guess you want a waveform viewer…
By reading your post, I have these 2 things in my mind.
Just to plot on Matplotlib
To convert the “.qraw” output into another data format of available waveform viewer.
==> To all folks reading this thread: any suggestion of waveform viewer software online available at no cost, and its data format open and available? Here, mixed-signal (both analog and digital) waveform viewer.
Ideally i would think an interactive window would be preferred. If displaying vector data is not something that native Qspice app is intending to support then I believe a matplotlib approach that can interpret .qraw data in vector form would be awesome. matplotlib has interactive features in their figures. Would this level of interactive features be sufficient?
==> @rmruthyun
Thanks. As you pointed out, after my last post, I found matplotlib offers decent flavors of interactive functions too. I think that’s enough to navigate / investigate simulation data.
By now, I think I can add a function to handle logic bus.
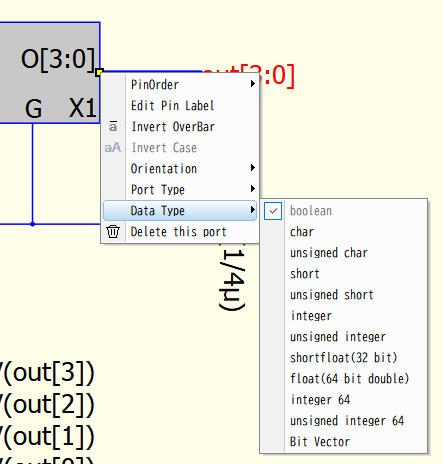
Just to confirm that you use “boolean” output of “bus label” like below?
This way, I can see how many bits on the port from my Python code.
==> @physicboy
Thanks for the link of nice library.
I’m thinking to stay with matplotlib for now until we hit a big roadblock of plotting with matplotlib.
I didn’t check it in detail but anything “Qt” must be pretty and supporting everything GUI programs need (but demanding more coding effort ).
Interactive procedures on matlab can do bus signal (3:0) stacking / separation…not implemented yet.
This mouse reading is slow…no optimization implemented yet.
I’m not changing bus value text font size, so a frequently changing bus plot will be messy but zooming into the plot will your label visible.
I have fragments of codes for “range slider” to zoom in x-axes (= time) but commented out now in the ipynb (not fully working in a pretty manner).
I’ll wrap this bus plotting routine as new PyQSPICE method so to make it happen with less user code.