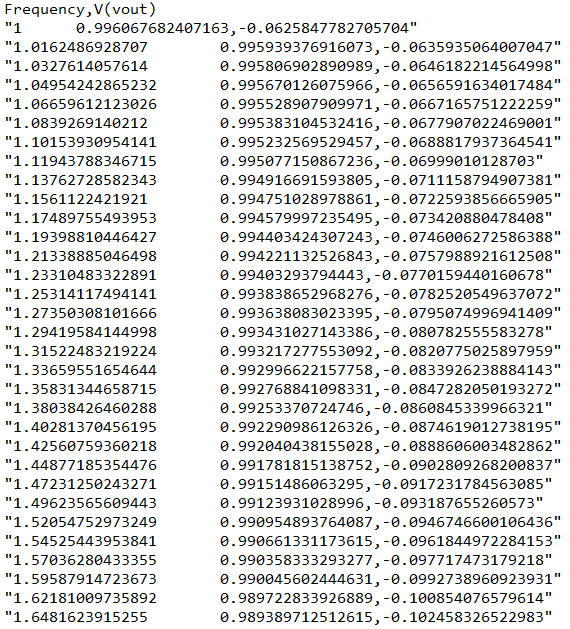
Then I rework this data in Matlab were I encountered my first weird part of this data.
Because my magnitude to dB is not from voltage to dB but form power to db.
This means that I needed to do 10*log(data points) to get the right magnitude plot.
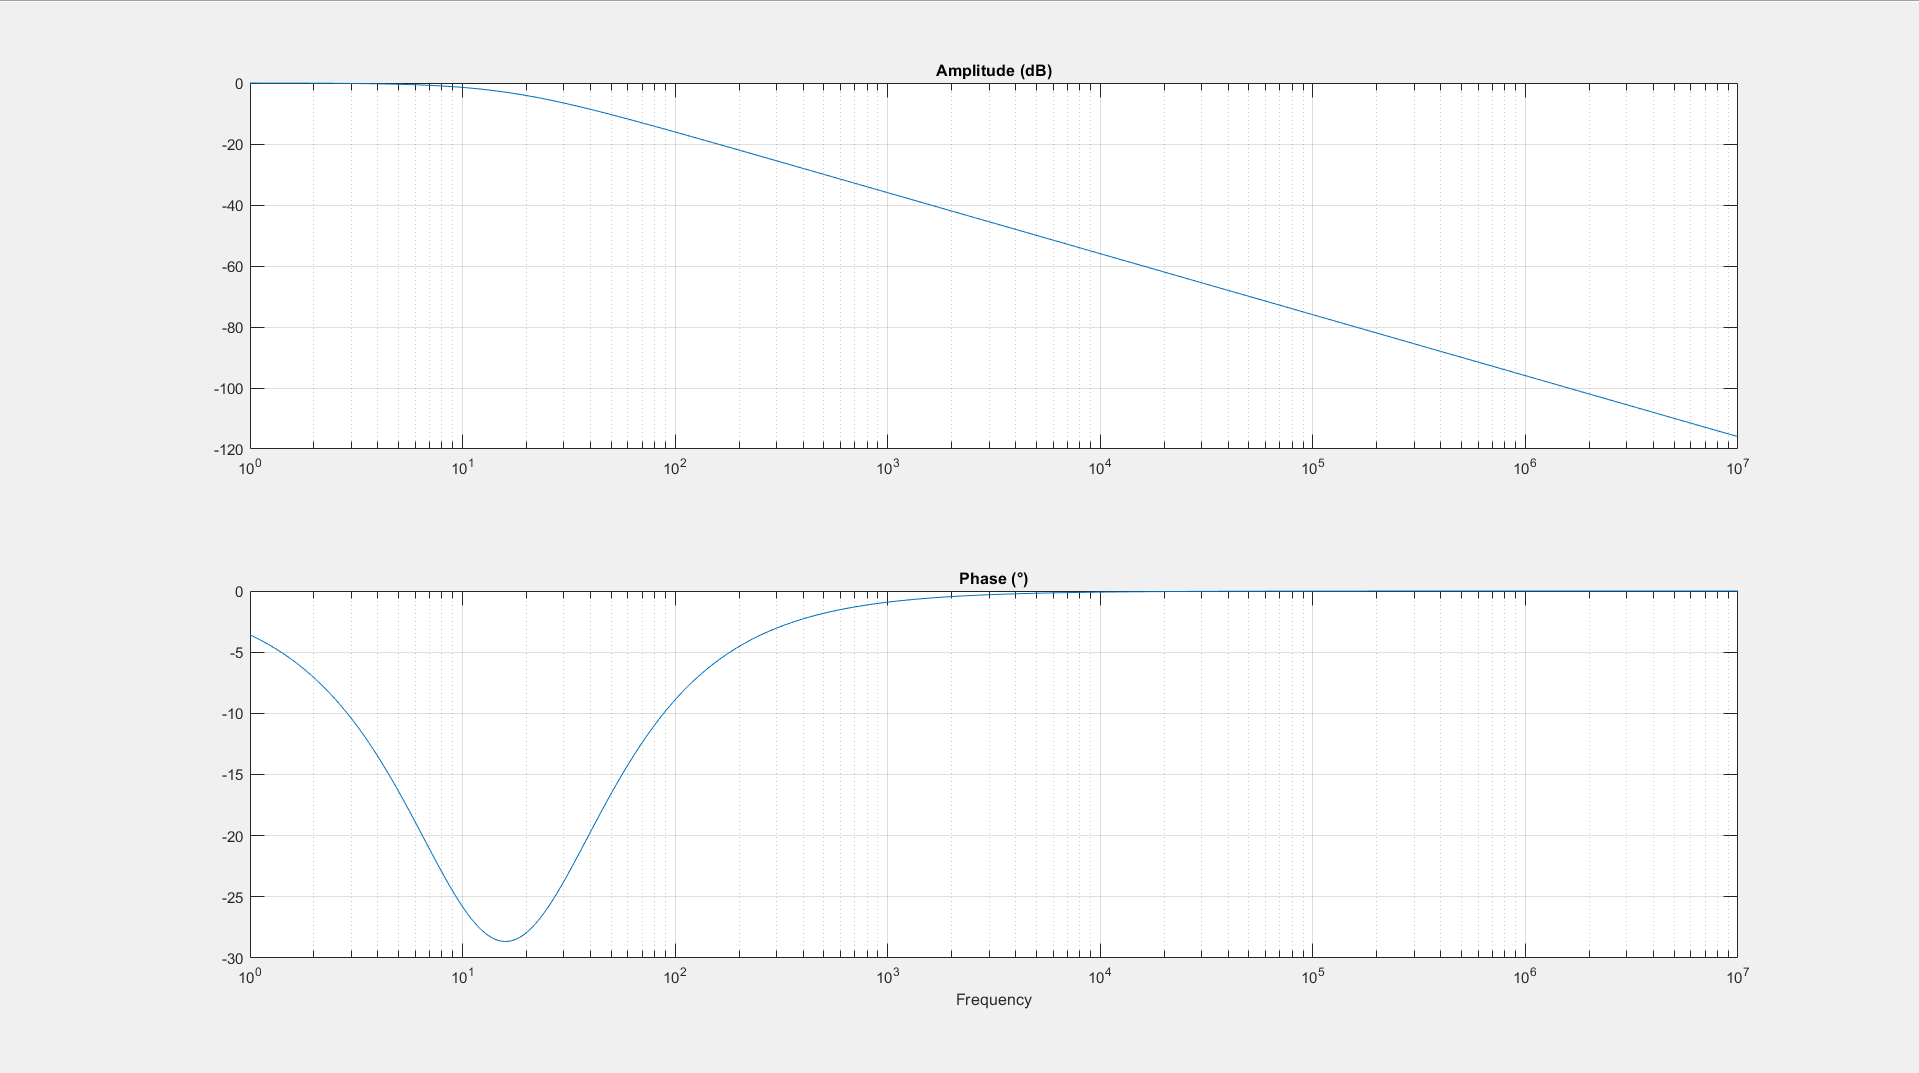
But the phase part I don’t understand. it looks like its in rad/s. but why does my Matlab plot go back to 0 degrees and not to -90 degrees??
I have a project of Matlab2Qspice which can directly read .qraw file (or execute Qspice simulation from .qsch etc…), this save your work in exporting into excel.
Thank you, I totally forgot that that also was a possibility. I’m used to LTspice so that’s why the confusion I think.
Another stupid mistake I made in Matlab was not using (./ or .*)with matrixes
Thank you guys for your help, I got it fixed in Matlab
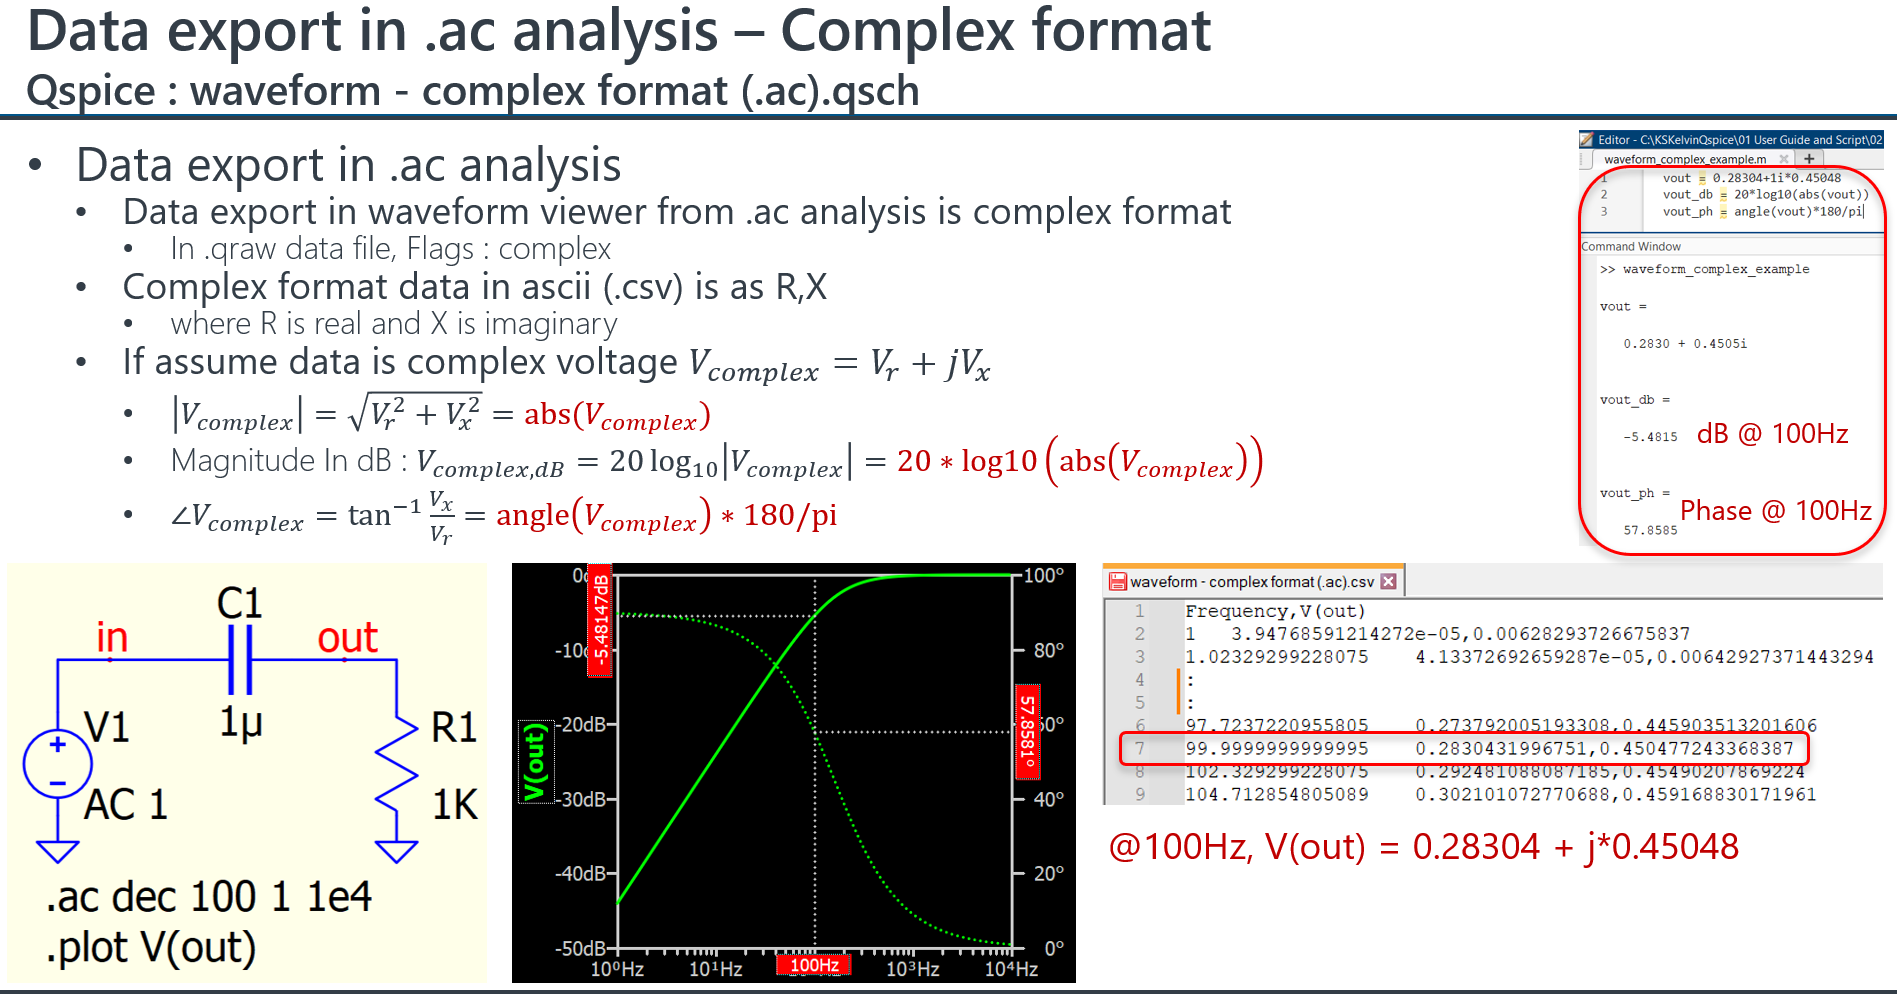
Good to hear your problem solved. As a LTspice user who switched to Qspice, I also experienced confusion initially regarding the export format in Qspice.