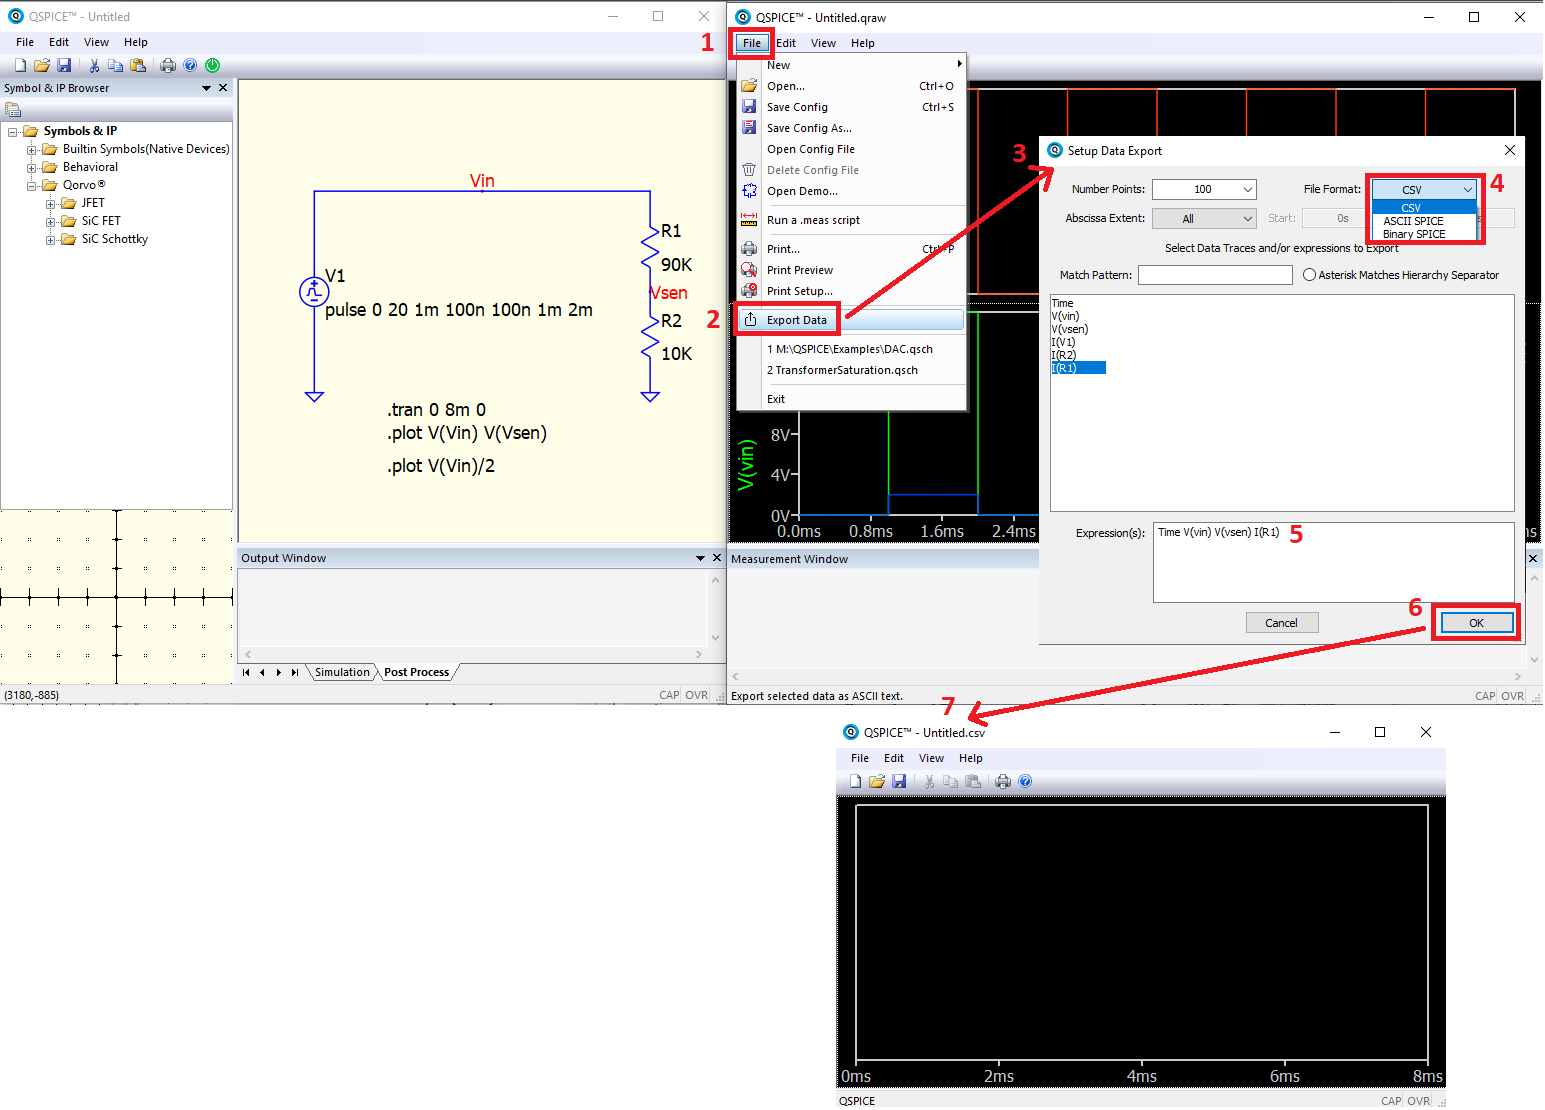
Trying to export data graphically, I’ll get a black window graph (step 7) and really don’t know how to proceed. You wait for a Windows Explorer to be able to save to a file. But … Sure I’m really doing some step wrong! Any suggestions?
Check your schematic folder and exported .csv should be there.
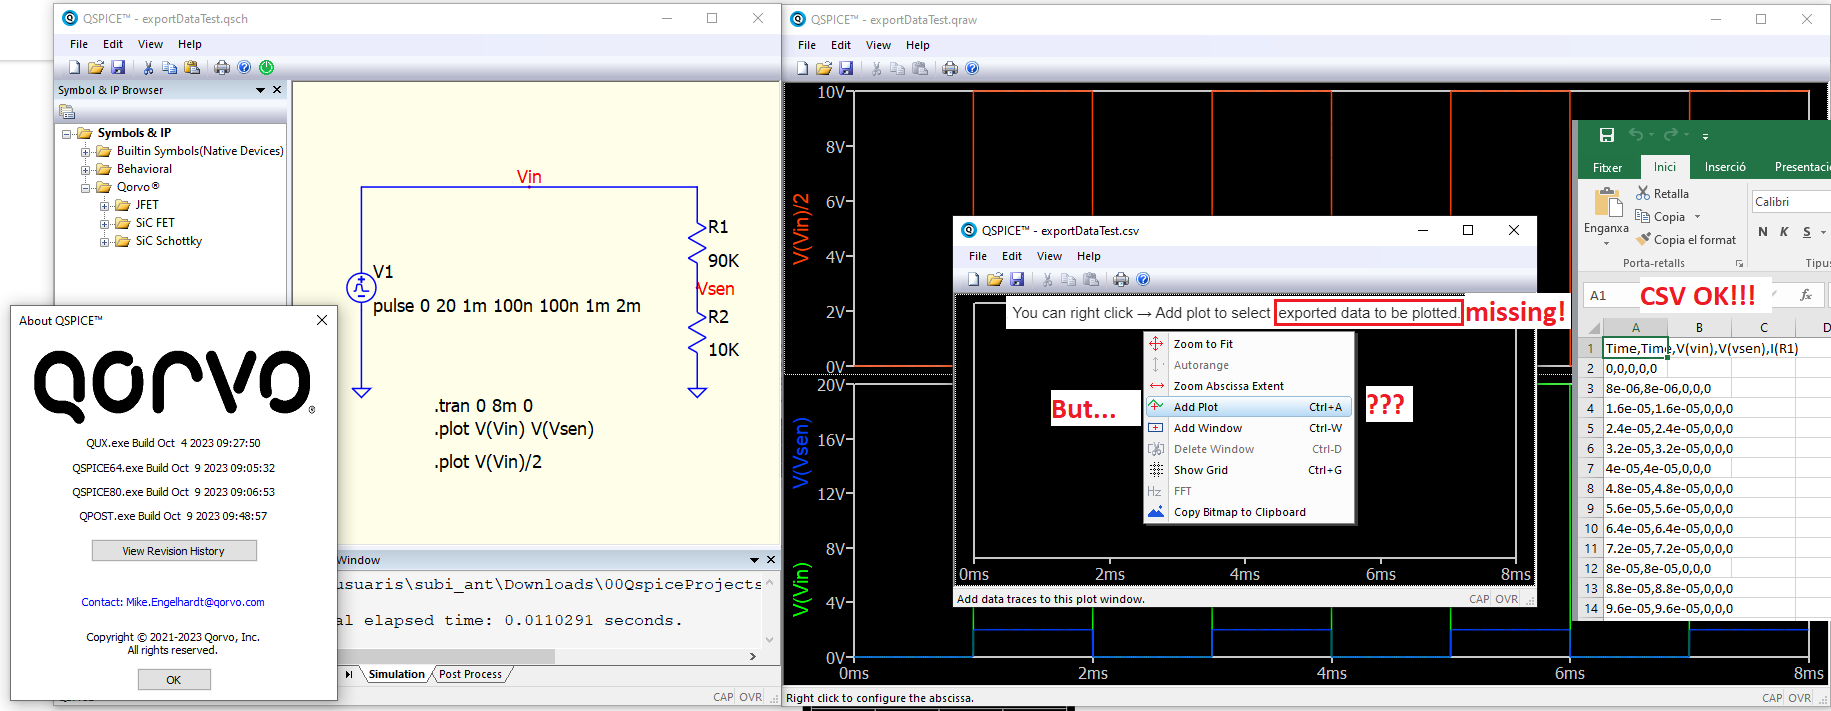
This waveform windows is just to let you play with this .csv file. You can right click → Add plot to select exported data to be plotted.
As you stated the cvs file is there but I dont know how to select it from the graphical/waveform window as you suggested. No “select exported data” option to be plotted.
Sorry, what exactly you want to do?
If you are talking about in waveform viewer, you want to view the export data, you can Right Click > Add Plot, and select expression you want to review.
Now I realize that it is correct. Now if I open the cvs file only the previously exported signals are shown (as it should be).
I was simply looking for a way to export data so I could process it with other programs (octave, matlab…)
For now, with simple circuits I can gain a foothold in the use and possibilities of the program.
Thanks again.
We are working on a Python library which works with QSPICE’s export command. This may allow you to process data externally more easily. We will have more information available about this within a week or so.
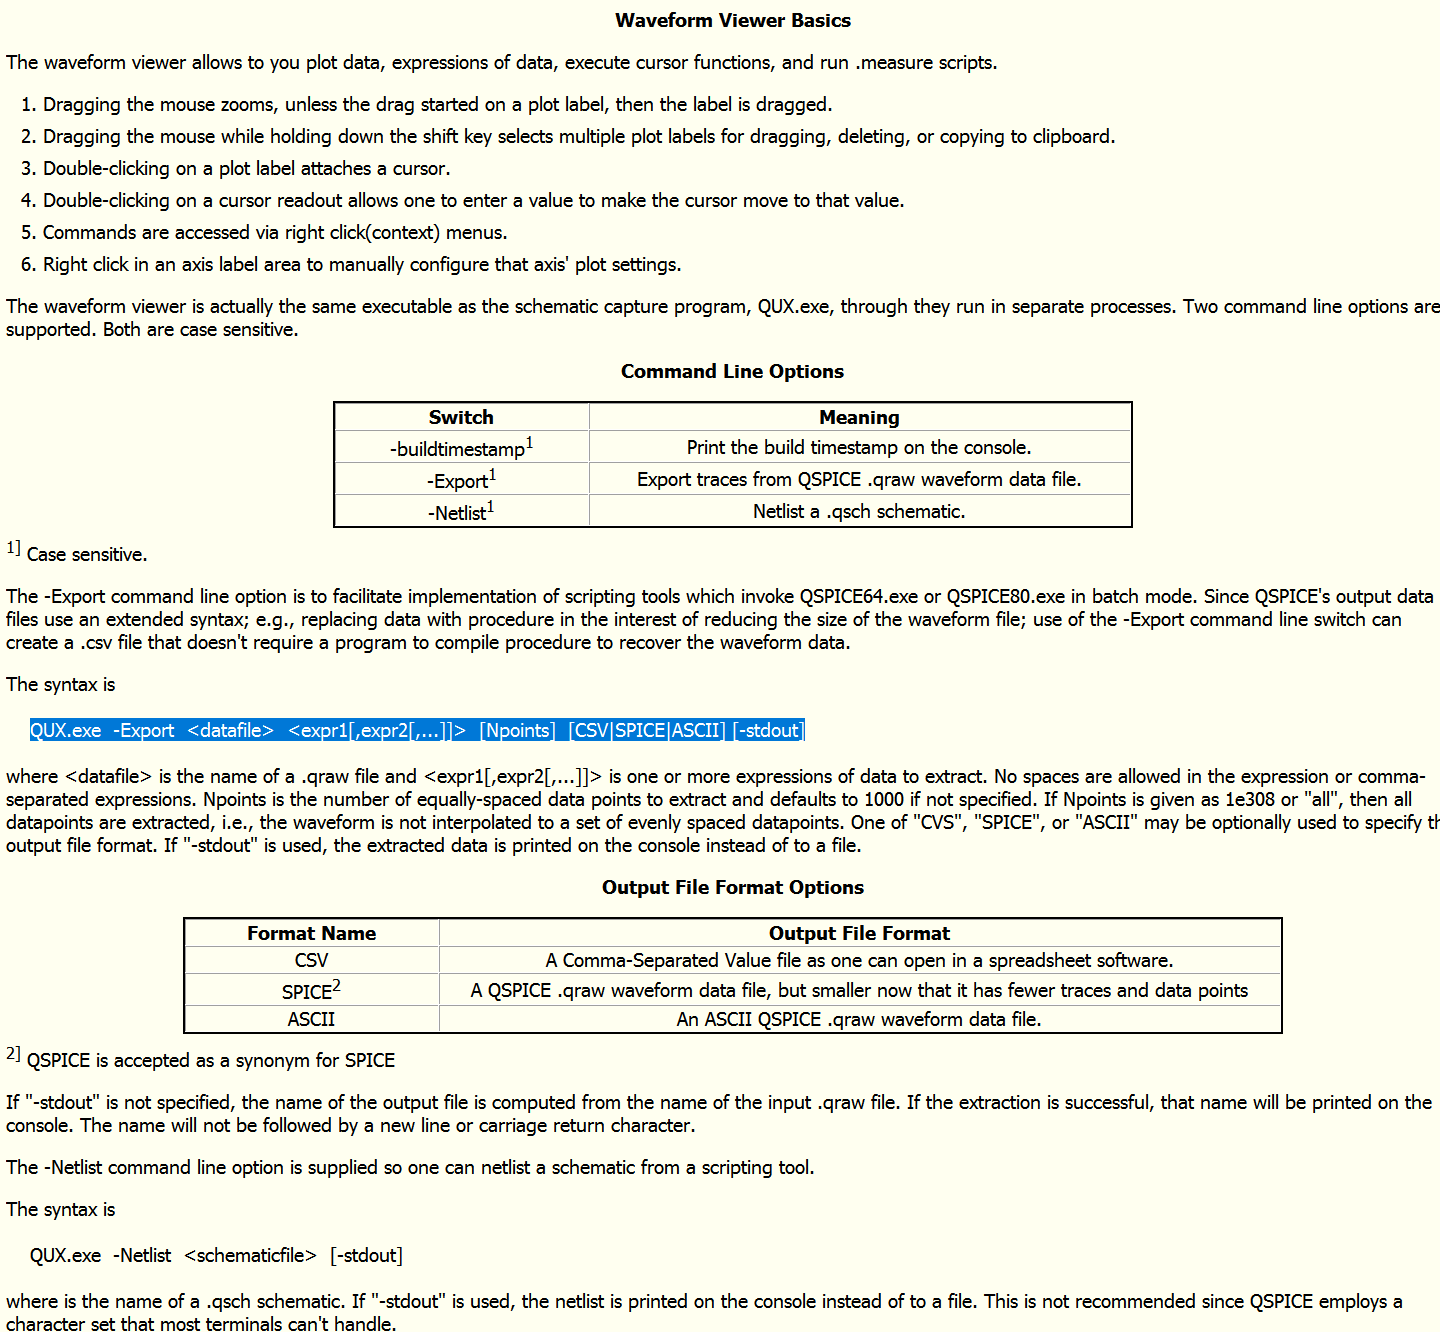
It can export your results to CSV with a command line.
Please check this portion of Help file.
One beauty of QSPICE output file “.qraw” is that it has all the signals in the way you can probe on the schematic to plot (after the simulation run). We just need to specify the right signal names to the QUX.exe program.