Hello, is it possible to use more than 6 colors for waveforms?
2 Likes
@KSKelvin Cool. How did you decide on the additional colors?
Ask AI to give me few RGB color that can look great in dark background.
Try them out to visually decide what look good.
1 Like
@KSKelvin How about doing a color set for white background?
I would rather use a dark background. But that’s no good for cutting/pasting into documents that might get printed (given that printer ink is more expensive by weight than gold).
What we don’t have is a way to switch between multiple color palettes. Colors aren’t saved in waveform config files (*.pfg) or schematic, they are saved in the Registry. I suppose that I could create a tool to do that if anyone thought that it would be useful. Of course, someone could ask Mike to add a save/load/select “Color Set” to the Color Selection dialog…
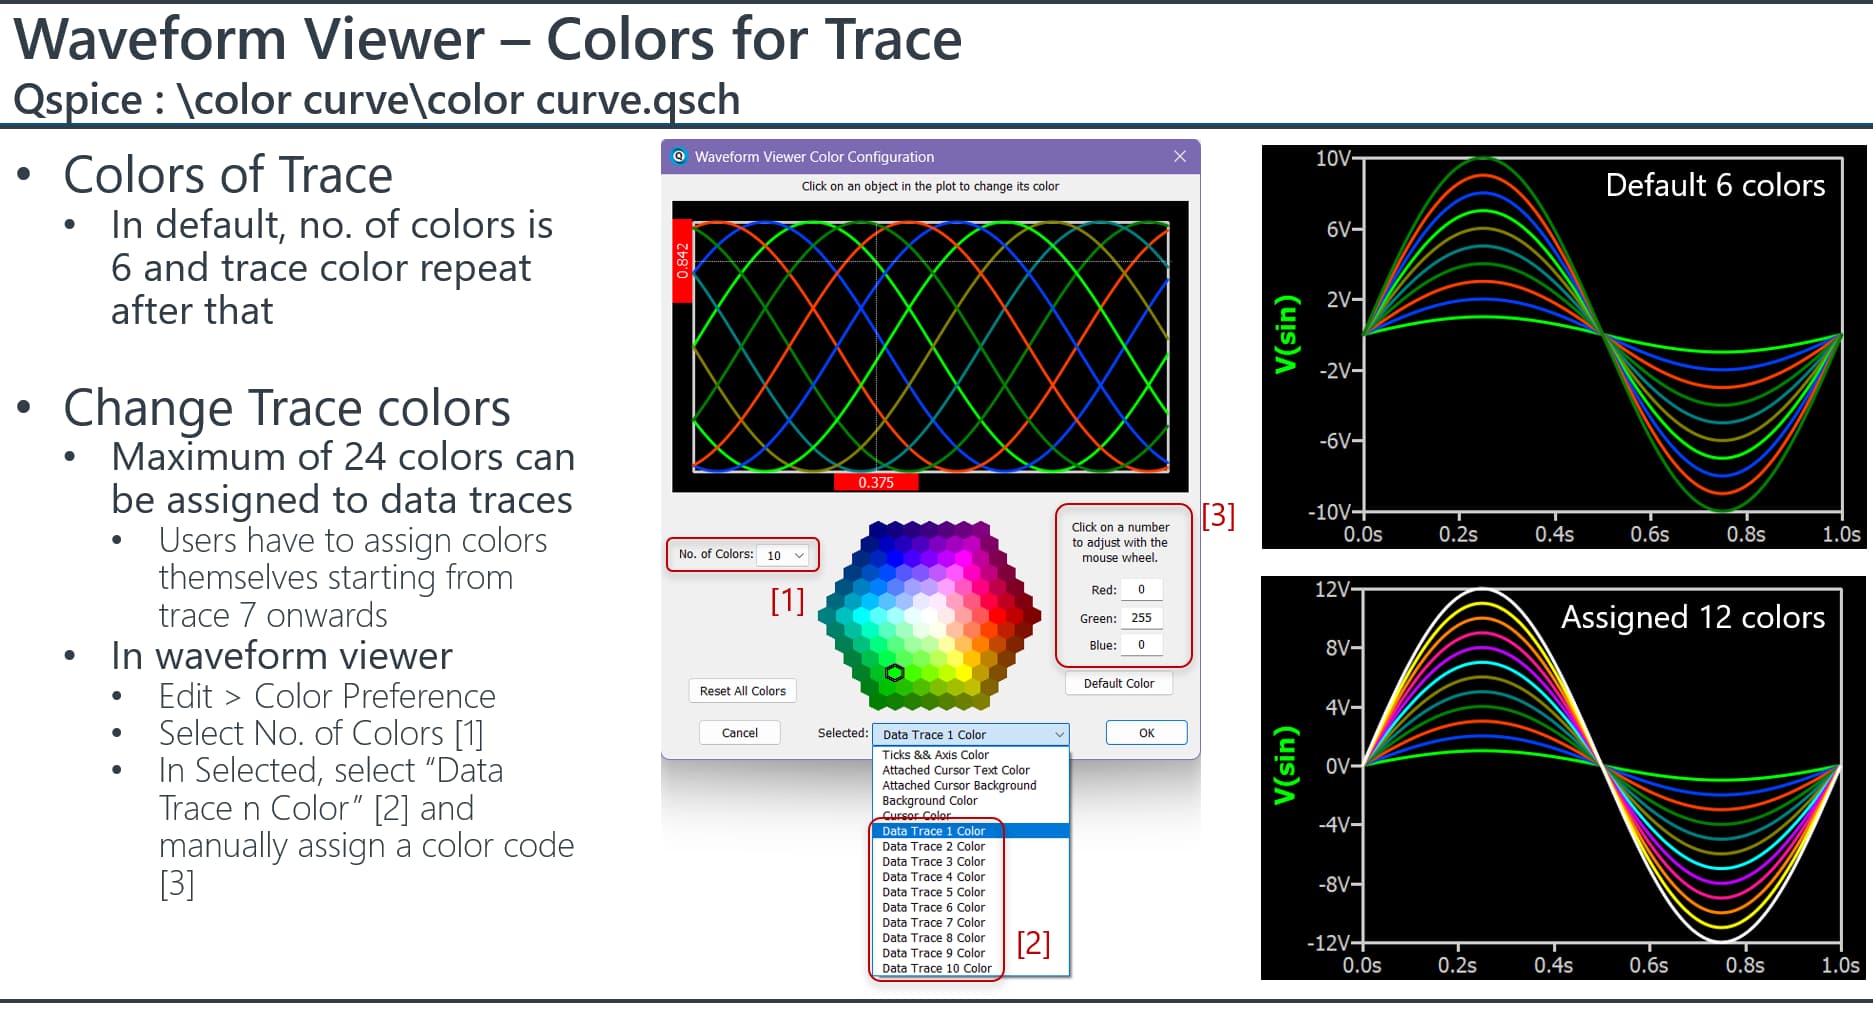
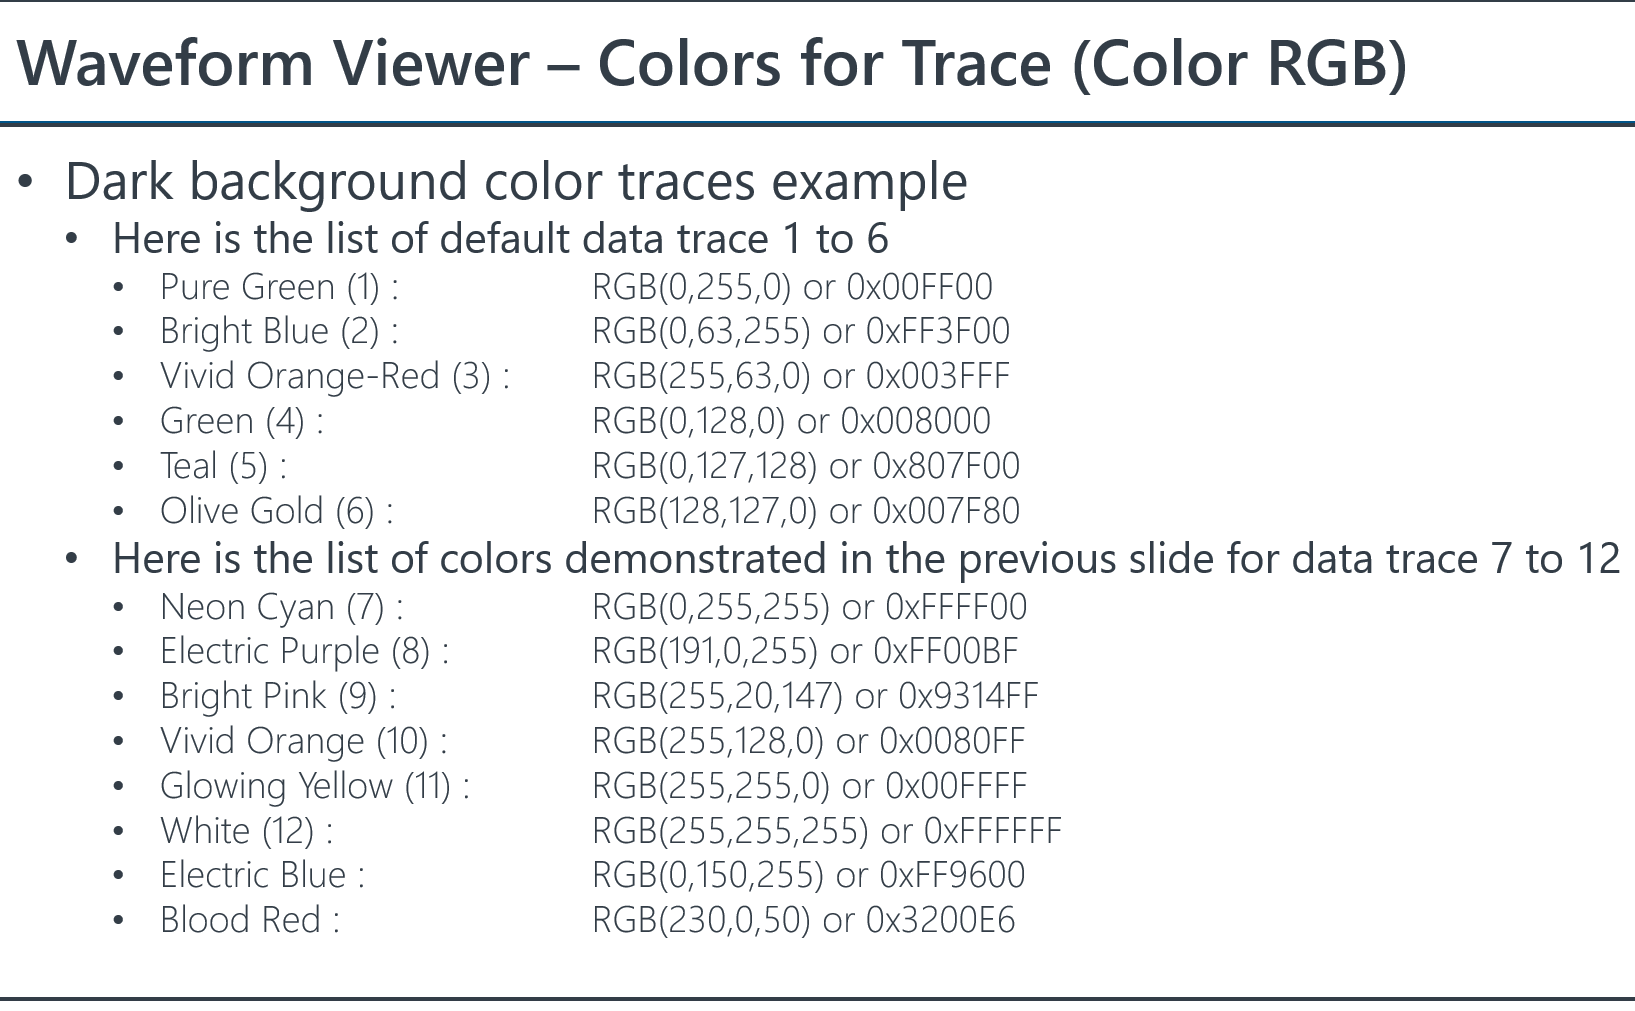
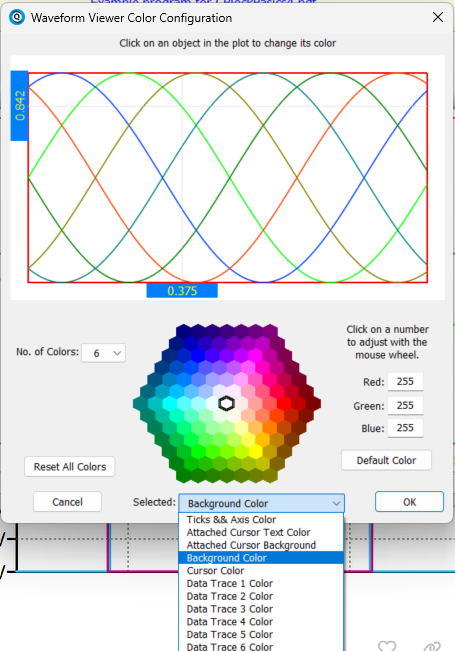
Well… I only use dark theme in Qspice for past 2 years. However, consider you asking, I suggest my favorite color scheme as below… this is matlab default color scheme in using plot(). Default is 6 color “gem”, and it have an extension “gem12” is 12 colors. Here is their RGB. This HEX is what I found in the Qspice registry after putting these RGB number into color preference
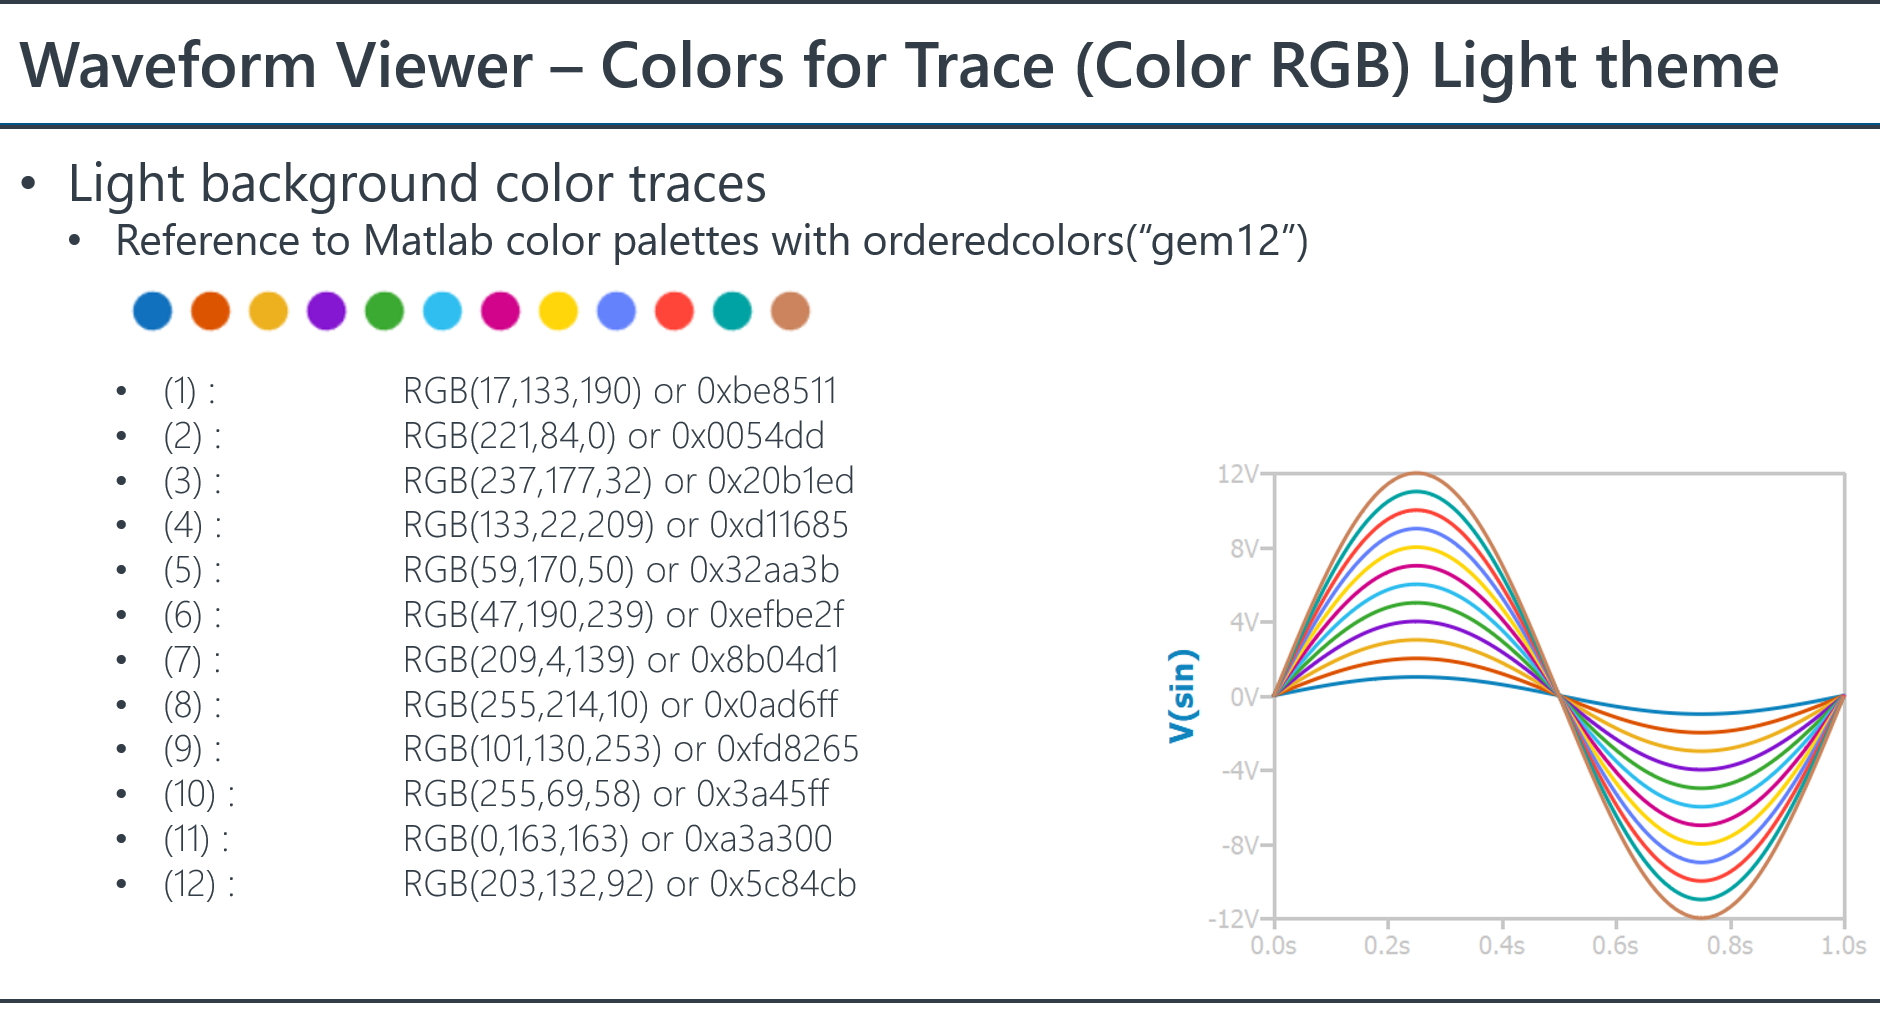
| # : | RGB(,) or 0x[hex] |
|---|---|
| (1) : | RGB(17,133,190) or 0xbe8511 |
| (2) : | RGB(221,84,0) or 0x0054dd |
| (3) : | RGB(237,177,32) or 0x20b1ed |
| (4) : | RGB(133,22,209) or 0xd11685 |
| (5) : | RGB(59,170,50) or 0x32aa3b |
| (6) : | RGB(47,190,239) or 0xefbe2f |
| (7) : | RGB(209,4,139) or 0x8b04d1 |
| (8) : | RGB(255,214,10) or 0x0ad6ff |
| (9) : | RGB(101,130,253) or 0xfd8265 |
| (10) : | RGB(255,69,58) or 0x3a45ff |
| (11) : | RGB(0,163,163) or 0xa3a300 |
| (12) : | RGB(203,132,92) or 0x5c84cb |
3 Likes
Thank you, Kelvin.
Mike said that he’s not planning on adding a feature for multiple plot window configurations so maybe I’ll give it a shot…
1 Like
Color numbers ≥8 and multiple plot are useful, especially in SMPS.
Multiple plot function can help us classify waveforms.
– Peter
1 Like
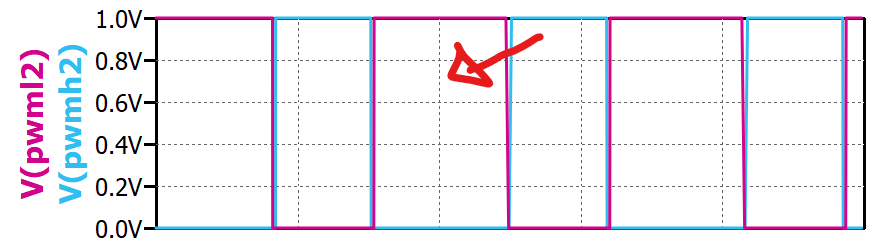
Is is possible to change the grid color?
When plotting waveforms sometime it’s beneficial to have the grid in a color similar to grey white ish…
@astybe ,
Besides the Data Trace color variations you can change the grid background. I realize this can be useful to prevent a lot of black ink from being used on a plot print.
Note: I have NOT found a way to change the grid line color.
Len
1 Like
FYI, I’ve released a tool for switching between color themes. See this post:
1 Like