Hi everyone,
I have two questions regarding QSPICE:
![]() Separate / Non-Synchronized X-Axis for Multiple Waveforms**
Separate / Non-Synchronized X-Axis for Multiple Waveforms**
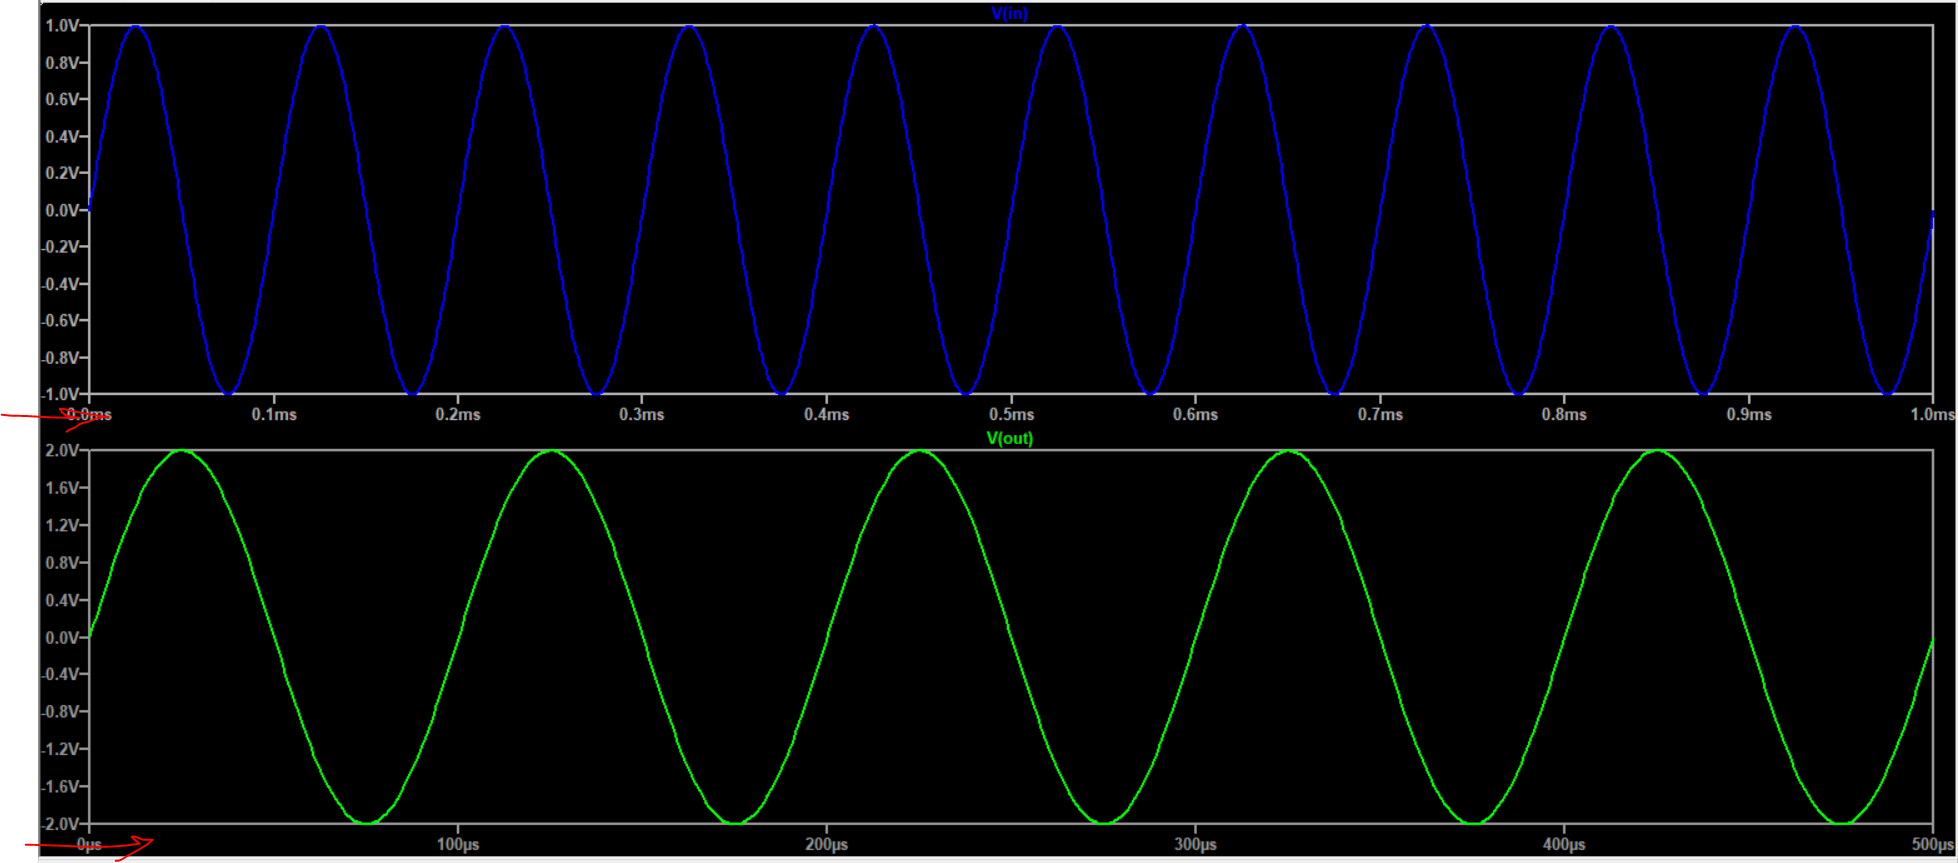
In LTspice, it is possible to display two plots with different and independent X-axis scales (for example, one in ms and another in µs), as shown in the attached image.
However, in QSPICE, I cannot find an option to make the X-axis of two waveform panes independent or unsynchronized.
Is this feature available in QSPICE?
If yes, how can it be enabled?
If not, is there any workaround?
![]() Custom Transient Command Symbol & Parameterized PULSE Source**
Custom Transient Command Symbol & Parameterized PULSE Source**
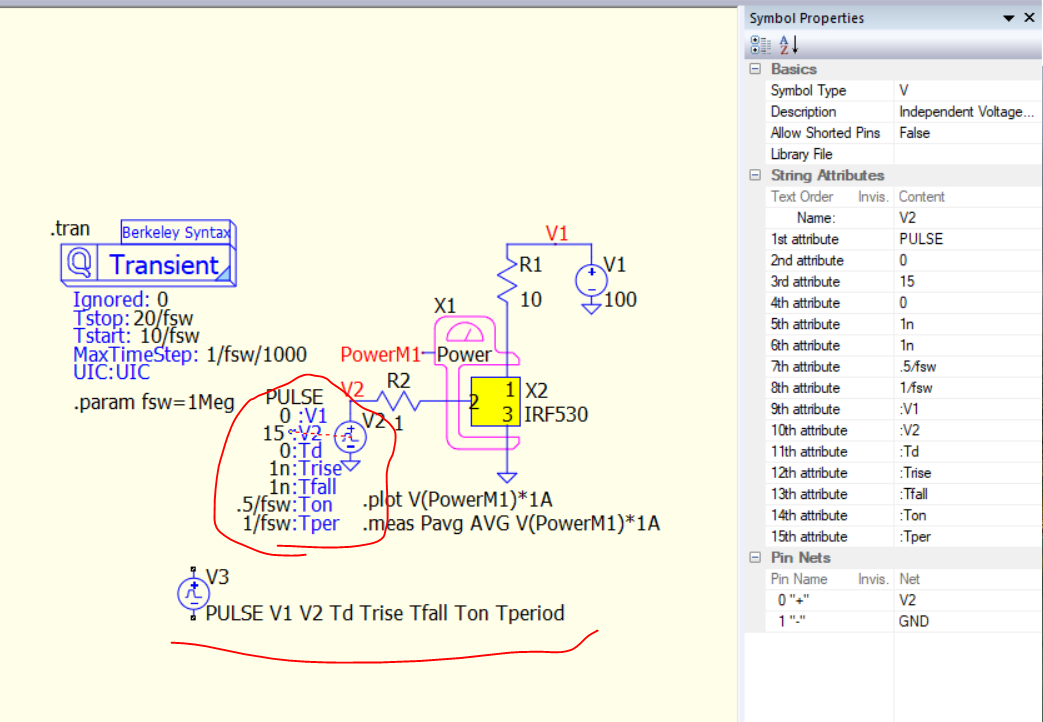
In the second image:
- The transient analysis appears as a graphical “Transient” block (Berkeley Syntax style), but I cannot find such a symbol in the QSPICE library.
- The independent voltage source is parameterized using expressions like:
PULSE 0 15 0 1n 1n .5/fsw 1/fsw
.param fsw=1Meg
In my QSPICE installation:
- The transient directive does not appear as a graphical symbol.
- The default independent PULSE voltage source symbol looks different.
- I cannot see how it was converted into that parameterized form with symbolic attributes (V1, V2, Ton, Tper, etc.).
My questions:
- How was the transient block created in that graphical format?
- Is that a custom symbol?
- How can I parameterize a PULSE voltage source like that using symbolic attributes?
- Is this done via editing symbol attributes manually?
Any clarification would be appreciated.
Thanks in advance.