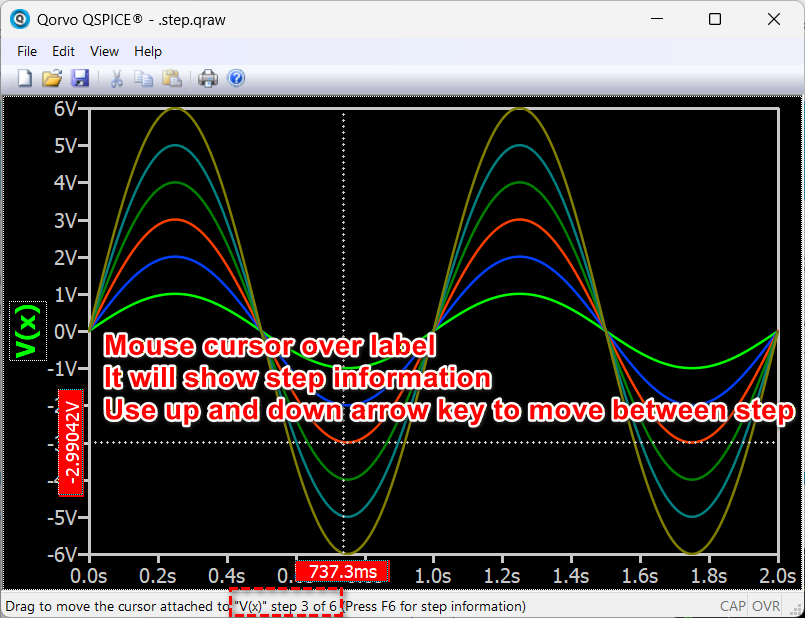
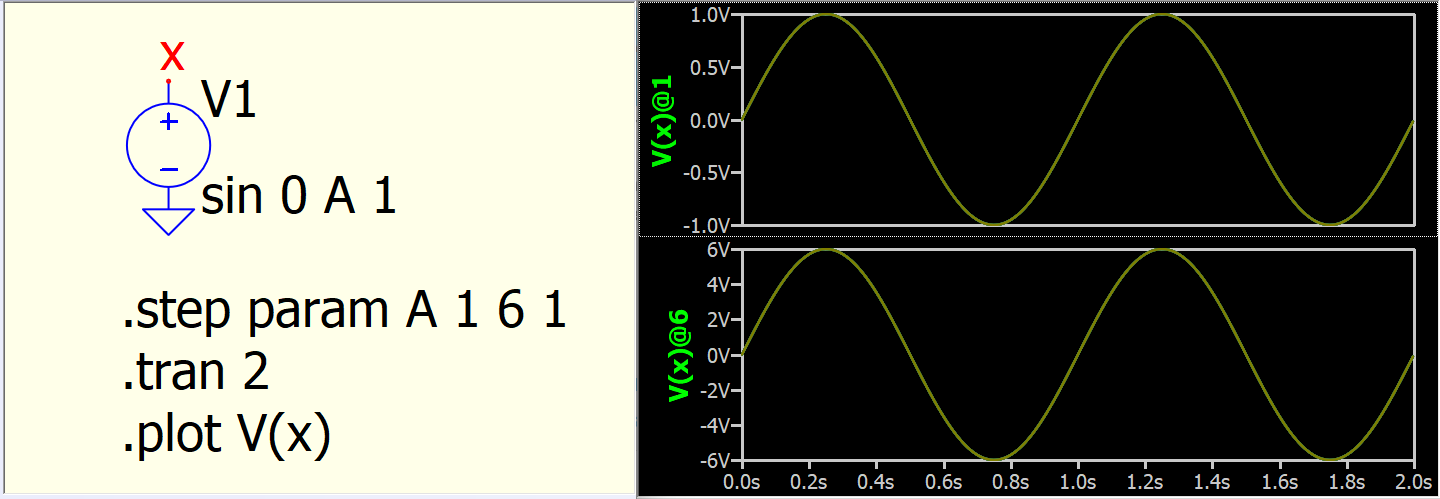
I ran a simulation where I sweep a parameter value. I can’t seem to figure out how to plot the results from the individual steps in the display window. None of the option when I right click in the deisplay window, on the trace name, or in the view menu seem to show the option to display individual steps.
I also can’t figure out how to know which parameter step corresponds with which trace when all the steps are displayed at once.
I have already posted the errors as well as suggested improvements to this topic. It seems that the cosmetic things are not yet done. We may have to be patient a little longer.
Has there been an update to this since posting in 2023? I’m interested in understanding how the waveforms are presented in the viewer for a step’d param simulation, and if there is a legend feature yet?