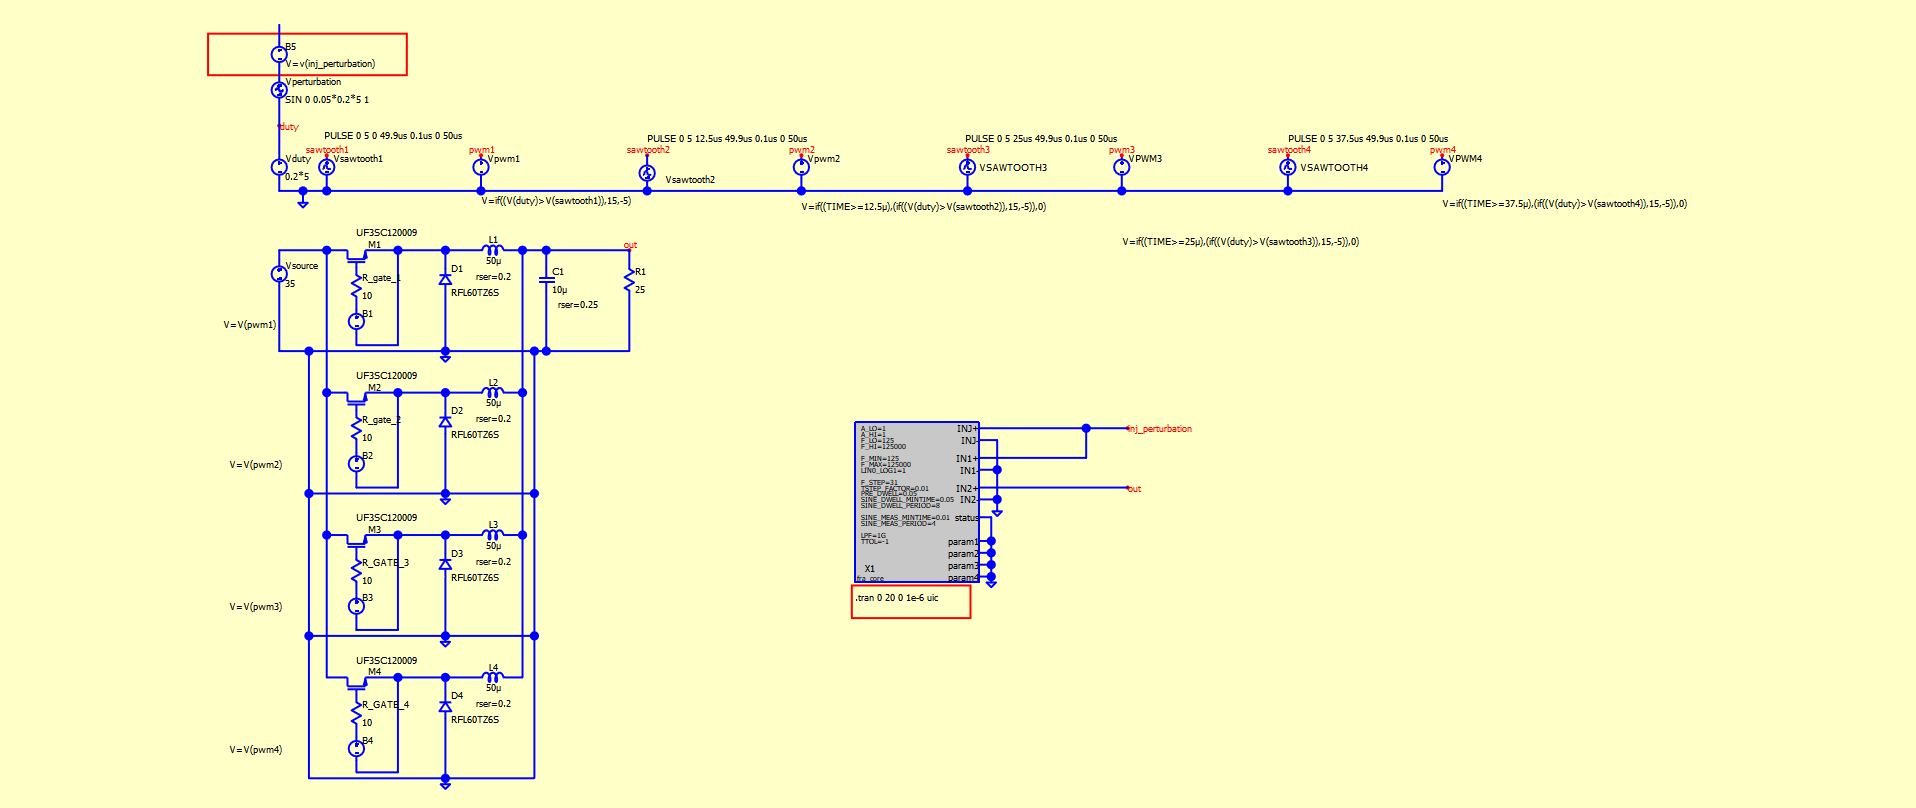
I am trying to obtain the open loop frequency response between output voltage and duty ratio of a 4 channel interleaved buck converter using the FRA block developed by @physicboy. No matter whatever I am trying, every single time I am getting the following error message:
This circuit has 4 floating nodes. From inspection, these nodes are believed to be floating:
¥4
¥3
¥2
¥1
Warning: Singular matrix. Check node VDUTY#BRANCH
Warning: Singular matrix. Check node VDUTY#BRANCH
Warning: Singular matrix. Check node VDUTY#BRANCH
Warning: Singular matrix. Check node VDUTY#BRANCH
Warning: Singular matrix. Check node VDUTY#BRANCH
Fatal error: Timestep too small(1.25e-19) at t=0
I have also tried the method explained by Prof. Marcos Alonso @marcos.uniovi, however, the post processing takes a lot of time and is not an efficient method for my laptop (because it is not a heavy machine). As I am new here, I am unable to upload my simulation file.
Have you try Qspice .bode? It didn’t meet your expectation?
I am not familiar with @physicboy FRA block, let wait for his reply.
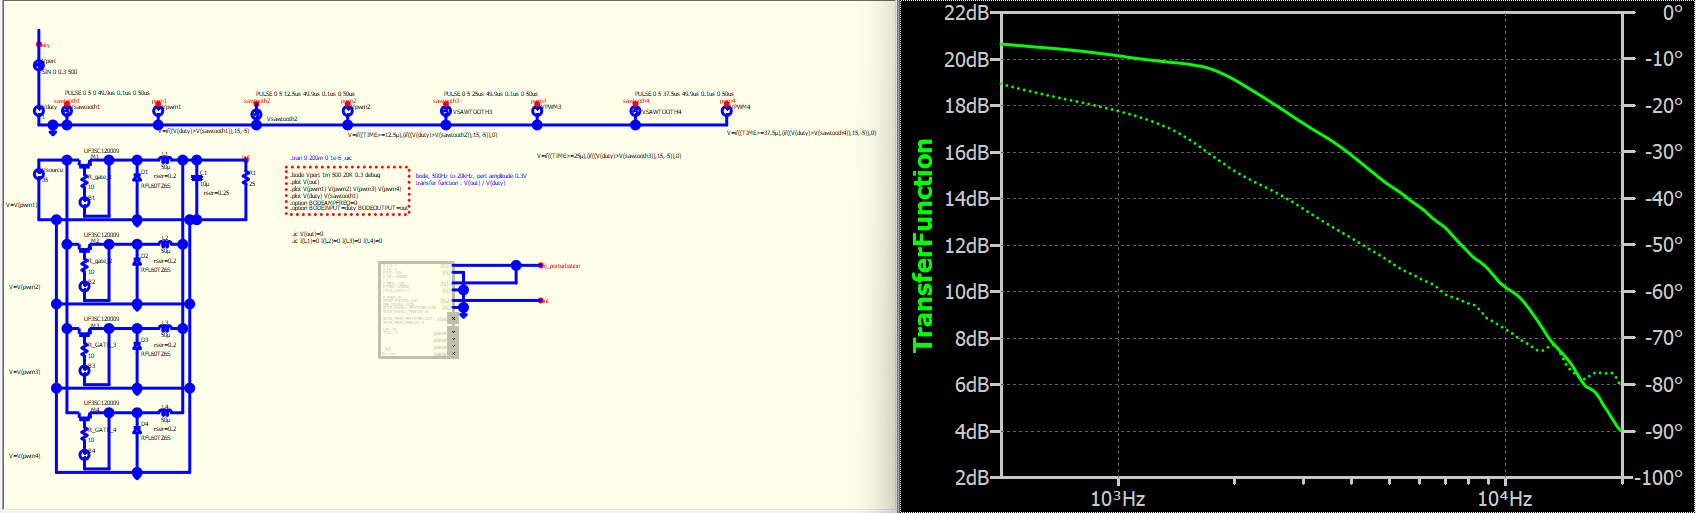
Here is result from Qspice .bode directive.
Apologies for not being able to reply in a timely manner. I was not well.
@macsky Thank you for pointing out the blunder that I had committed earlier. Adding that behavioural voltage source was the key. Simulations ran very well after making that change.
@KSKelvin Thank you for sharing the alternative .bode statement, however, I have a few question related to exporting the data.
Is logarithmic sweep possible while obtaining bode plot using the .bode statement?
After opening the .CSV file containing the data, the first couple of entries are like this:
Frequency TransferFunction Freq Omega
“10 11.5118358325893” “-0.472151153784861 10” “0 62.8318530717959” 0
“10.0506516335329 11.516542666924” “-0.473446869377442 10.0506516335329” “0 63.1501066713944” 0
2.a) Why frequency and transfer function both contain paired values?
2.b) What are the units of 11.5118358325893 and -0.472151153784861 respectively?
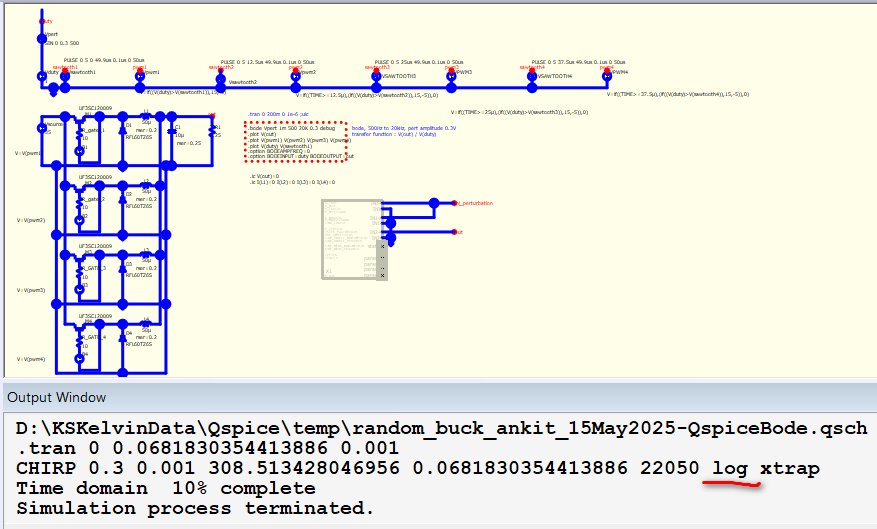
The perturbing source is always log sweep (except you use square wave perturbing option). It is a CHIRP source and you can see from Output Window if debug is enabled (refer to Qspice Help, Voltage source for more detail).
.ac or .bode export data into (real,imag) rectangle complex number format. Currently, Qspice doesn’t have option to export as polar (magnitude, phase), and you have to post-processing by your own.
Thank you so very much for replying immediately and answering my queries. I went through the links that you shared and it helped me understand the concept in a better manner.
Post-processing on many occasions takes a lot of time and resources. I just hope Mr. Engelhardt and other developers can come with a solution that reduces the post-processing time. Fingers crossed!!
I have one trivial question though. Let’s say duty = 100% corresponds to 5 Volts. And the circuit is running at 20% duty or 1 Volts. So how much should be the perturbation magnitude? Or in other words what % of duty is an acceptable perturbation magnitude?
Regards,
Ankit
PS: I wanted to accept your explanation as an answer too, however, there can only be one solution to one problem as per the rules here.
The concept of a bode plot with perturbation is ensuring that the perturbation is substantial enough to induce a measurable change while remaining small enough to maintain linearity. The rule of thumb is for each frequency, your perturbation should be large enough to drive a measurable change in the output (considering that SMPS output exhibits ripple, requiring sufficient signal amplitude to overcome it). In high-gain regions, a smaller signal amplitude is anticipated to prevent saturation from overdrive, while in low-gain regions, a higher signal amplitude is expected to induce sufficient change. I normally begin with constant amplitude over all frequency, and review if need reduce or drive more.
Therefore, for instance, when utilizing .bode, the debug option is crucial for me to analyze the perturbating amplitude. Monitoring the time-domain response is highly essential. I have a document that explains what I have learned from working with .bode; you can refer to it for additional information.
Waveform viewer should handle the plot in polar (linear, dB, log) or cartesian (complex number) format. In general, export is not required.