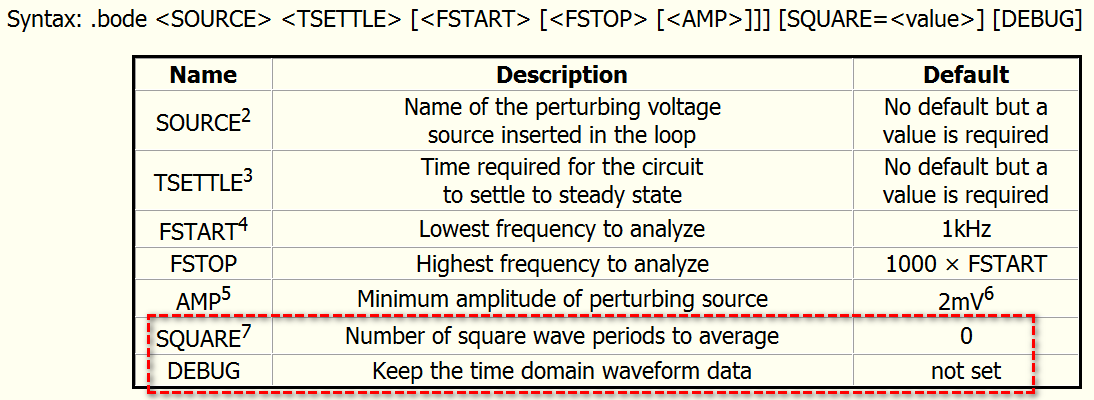
.bode is not the best tool to handle your request. In QSPICE, two directive for frequency response analysis, .ac and .bode, you can go to Qspice Help for more information, here is a quick summary
- .ac : small-signal ac analysis linearize the circuit at dc operation point, this is equivalent to what the standard textbook do for a BJT circuit
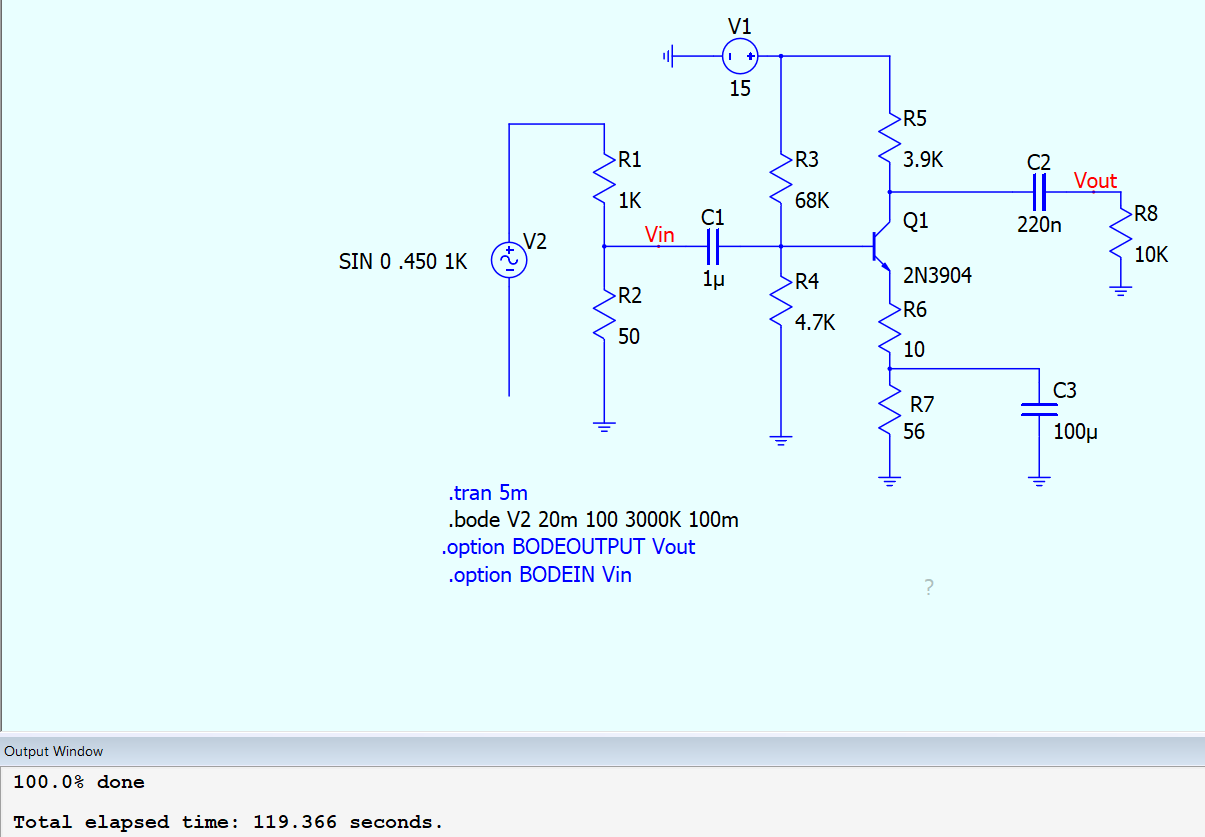
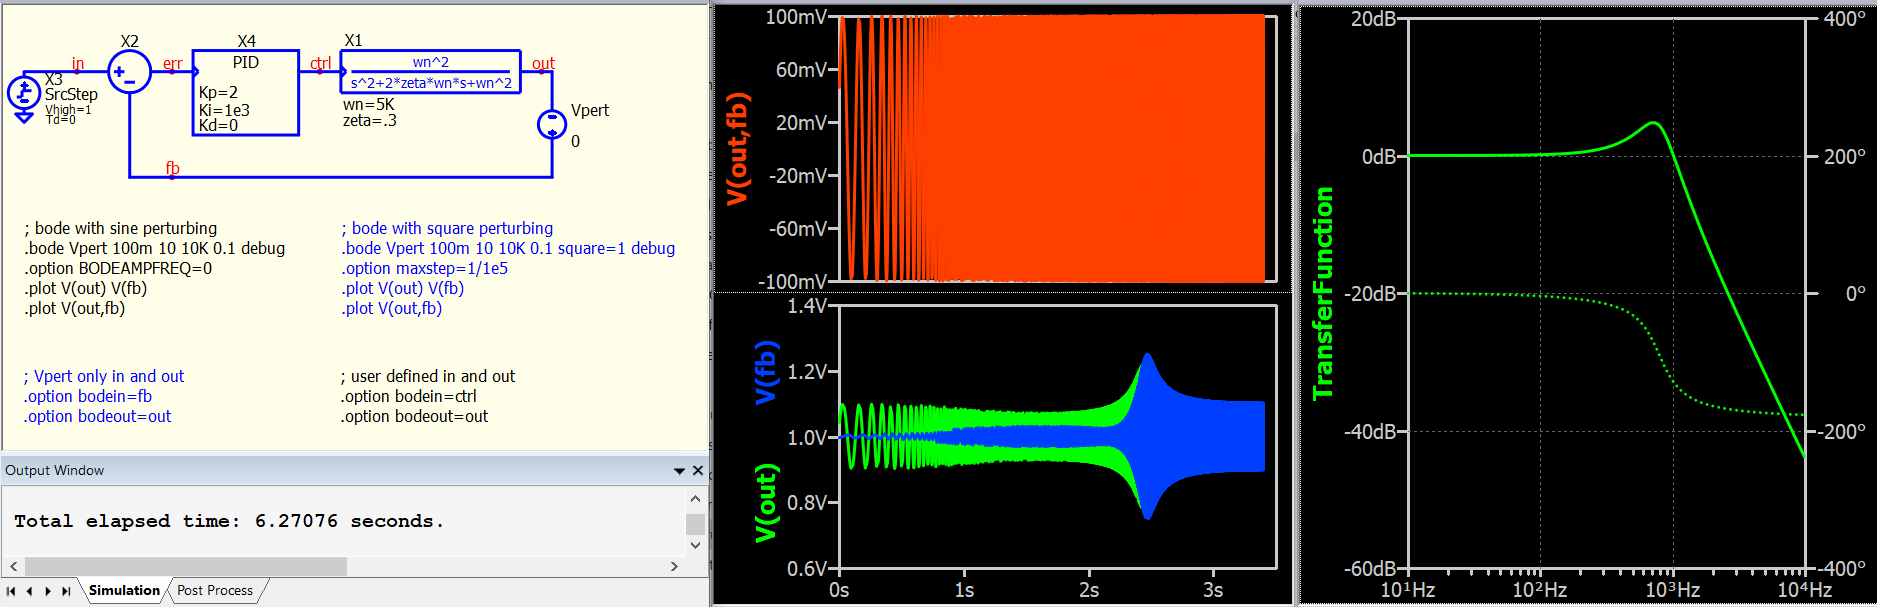
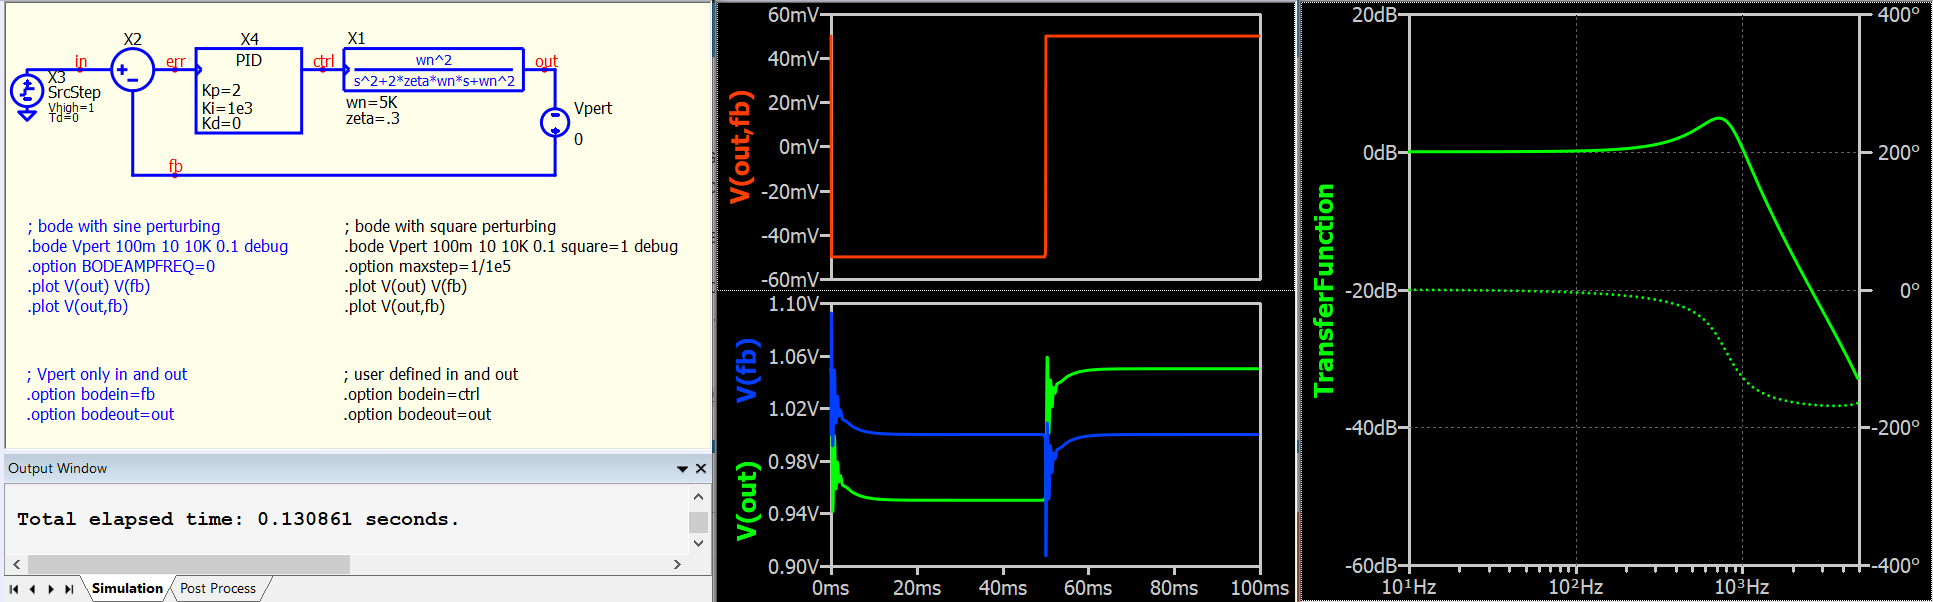
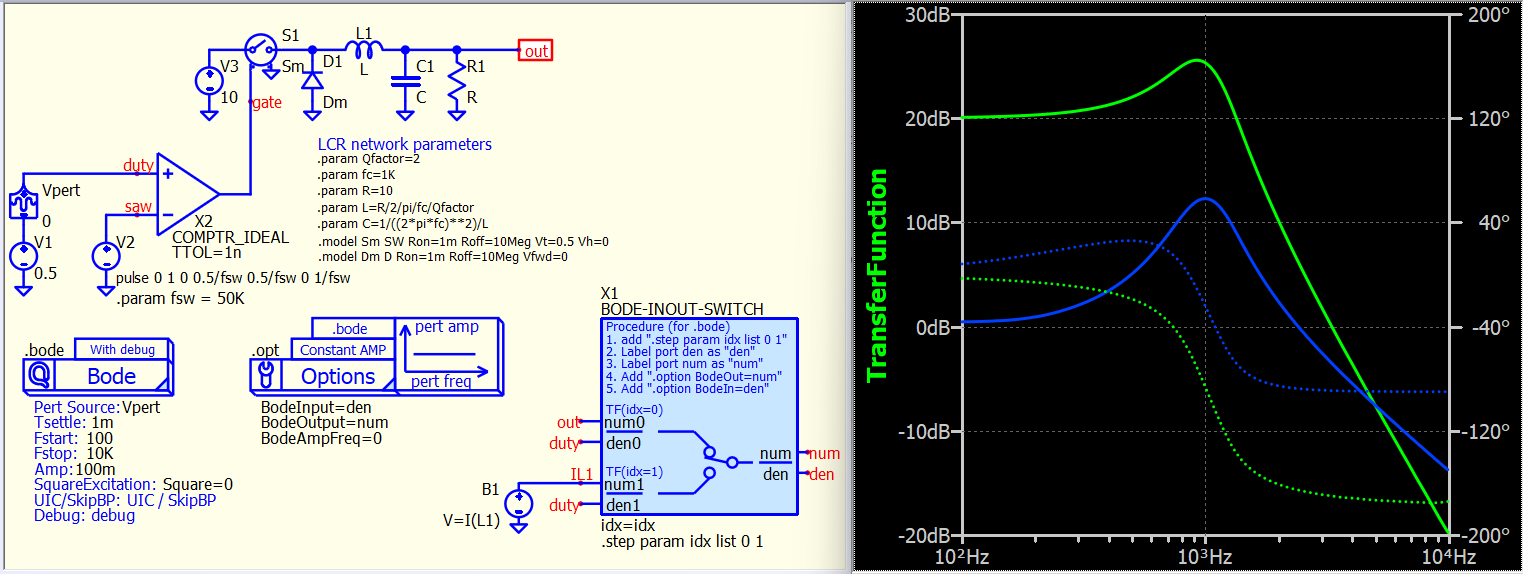
- .bode : use a perturbating source to inject ac signal and run time domain simulation, use FFT to get frequency response from time domain data. This technique is normally for switching circuit
You didn’t attach your schematic, therefore, I am not quite sure if your have .model to support Q1 as 2N3904, just beware that 2N3904 is not in standard Qspice library, you can add a .model for that, but in following demonstration, I changed to MMBT3904, you can right click on Q1, to select a model from there.
As you mentioned for teaching purpose, and you are new in SPICE, let me give you a brief example of what you can do with Qspice.
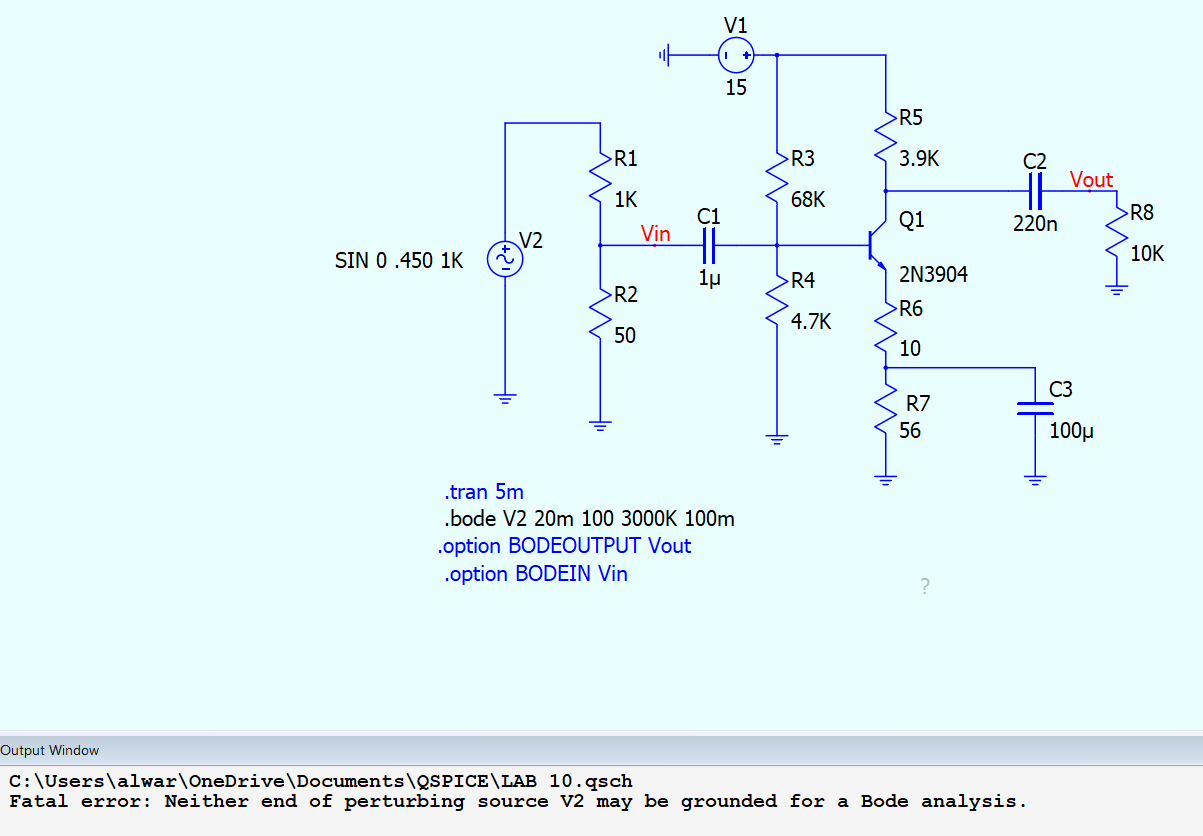
This single schematic can run a .op, .tran, .ac and .bode analysis. What you need to do is that, you only let one directive active before run simulation. If you switch directive, close the waveform viewer first. To switch directive, mouse hover the directive, press “;” to toggle comment or not. I add a Vdummy 0V source in series Vpert, the reason is that, .bode must have the source disconnect from GND. In series a 0V source can do the trick.
BJT-Circuit.qsch (9.8 KB)
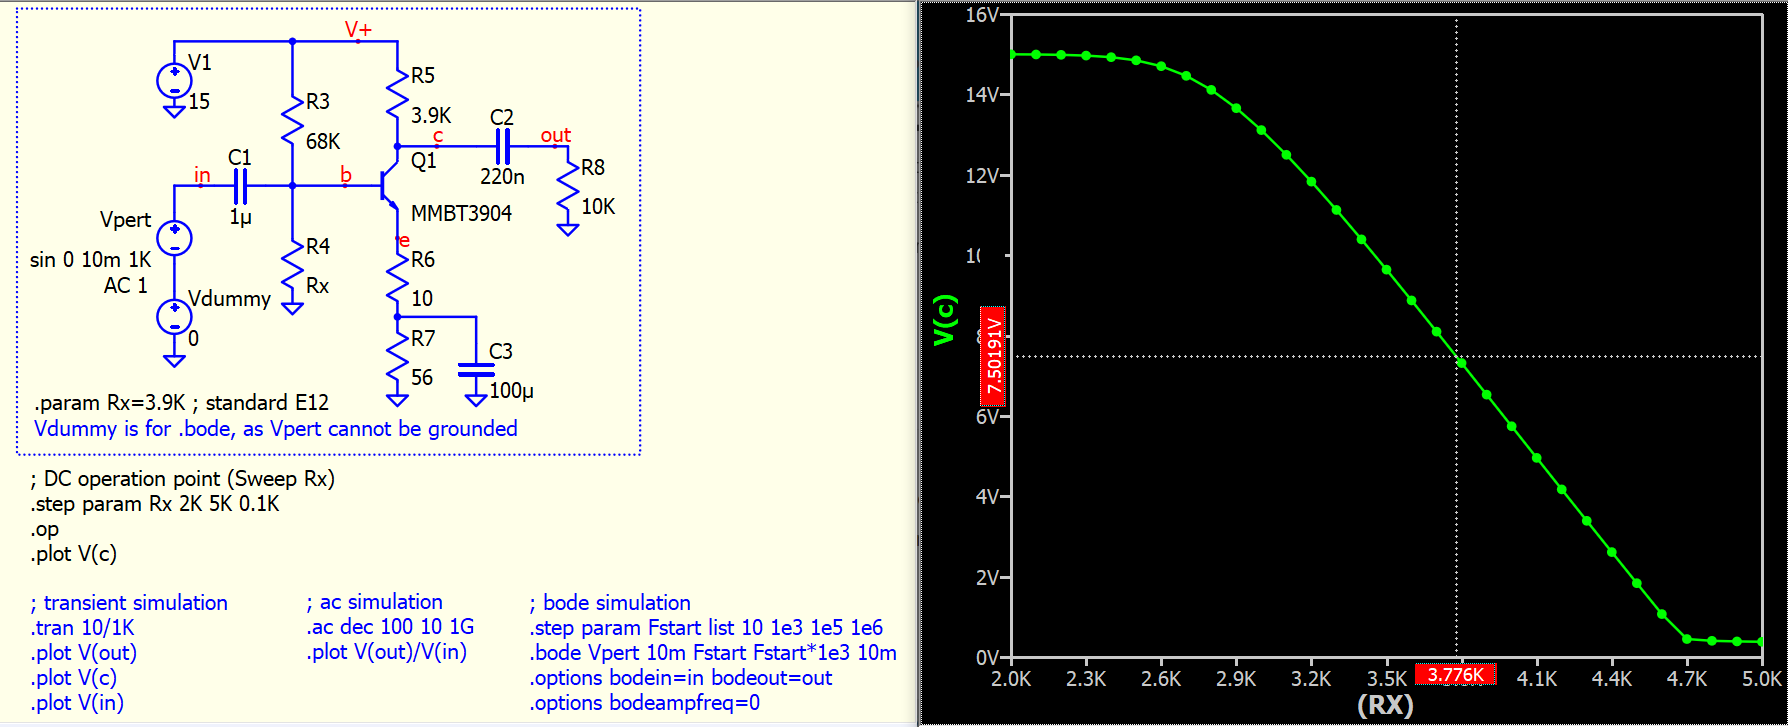
DC Operation Point
As I changed Q1, I have to re-adjust bias condition. .op with .step can give V(c) vs R4 relationship, which help to quickly identify what R4 should be. Midpoint is at R4=3.7kohms, and in standard E12, R4 is selected as 3.9kohms in following analysis
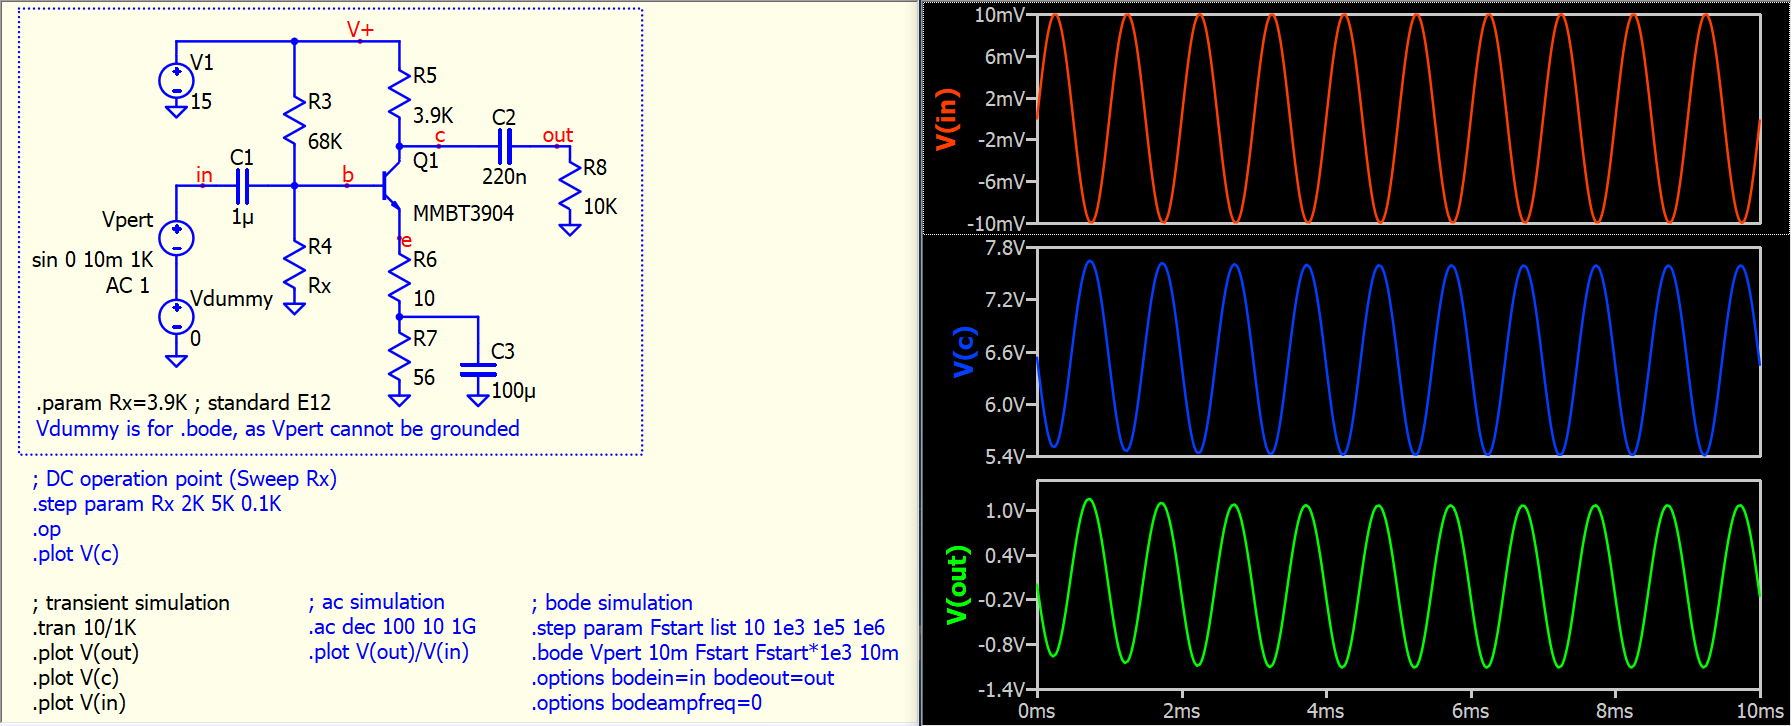
Transient Simulation
In Vpert, sin 0 10m 1k is used, A sine wave 1kHz, 10mV is injected from V(in), and transient can help to ensure what is proper input signal range for .bode.
AC Analysis
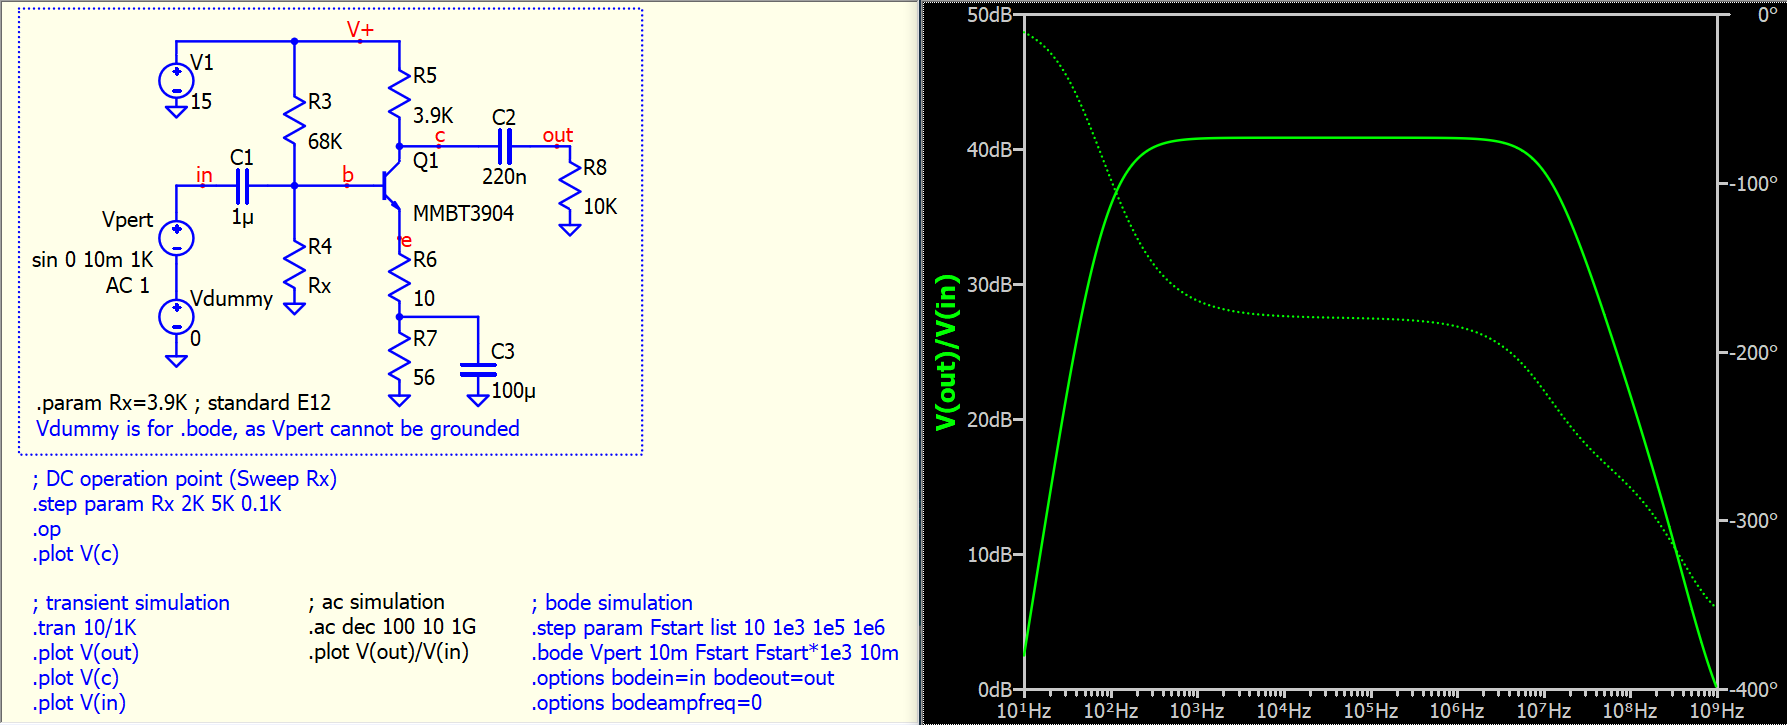
OK, this is to answer your question. Here, Vpert with AC 1, which means we have a magnitude 1V, phase 0 degree AC source at Vpert. As circuit is linearized in .ac analysis, this “1V” magnitude will never saturate the circuit (if you put a 1V in sine function in .tran, you will see amplifier is saturated). The ac directive in here is to sweep freq from 10Hz to 1GHz, 100 points per decade. And this is the result you are looking for.
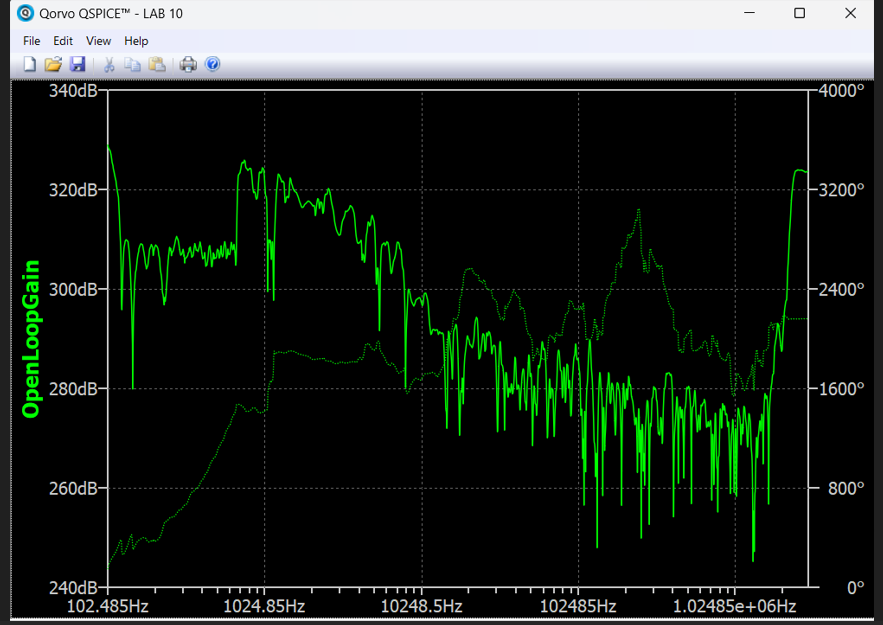
Frequency Response Analysis
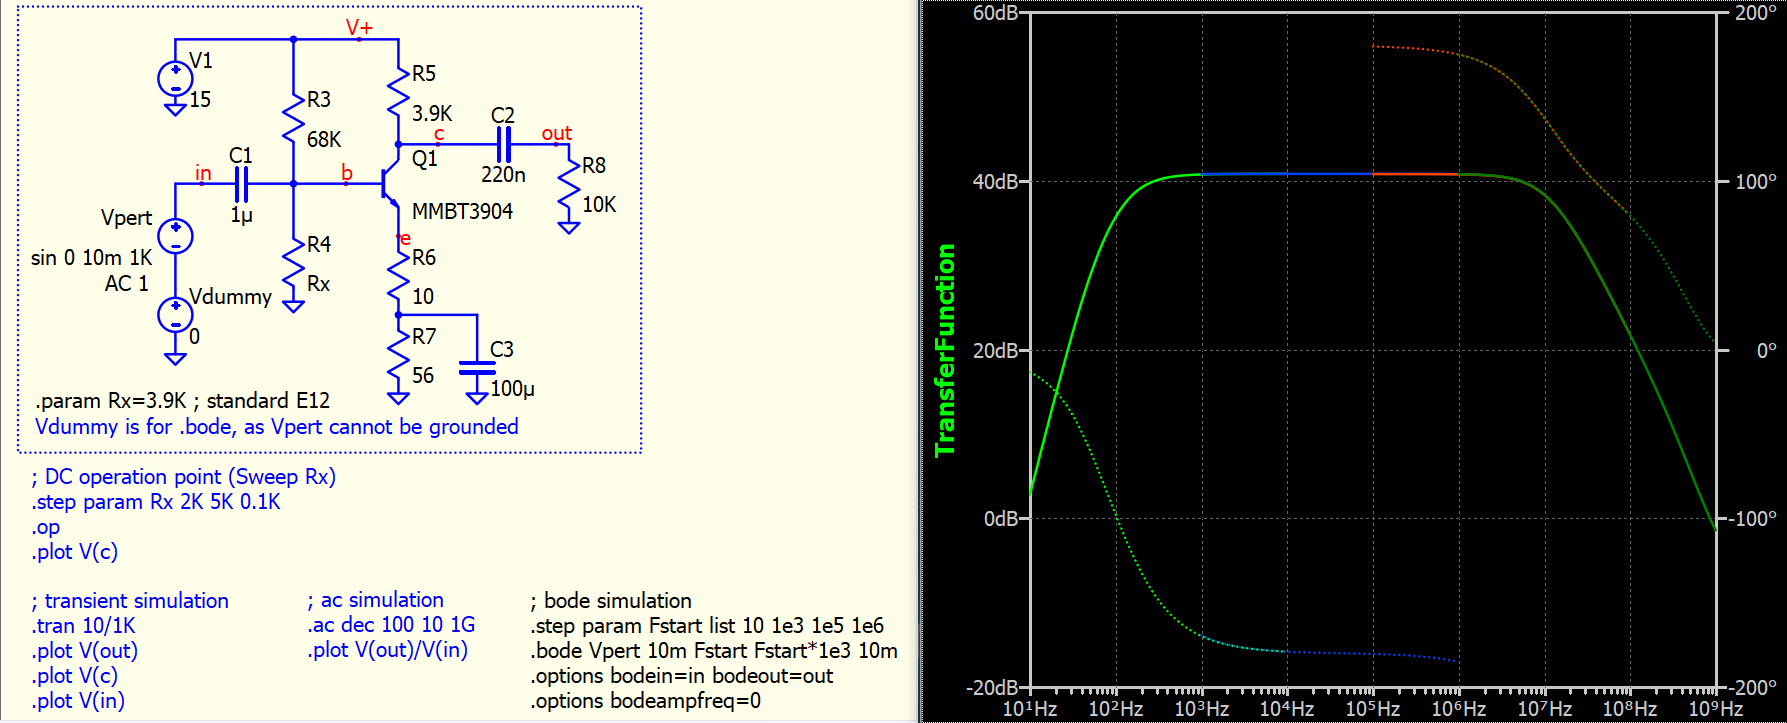
Finally is .bode analysis. Actually, in your case, you don’t have to use .bode, but as demonstration, I still give you this example of how to use .bode to generate frequency response. However, to use .bode, you must be familiar with all setting in .bode
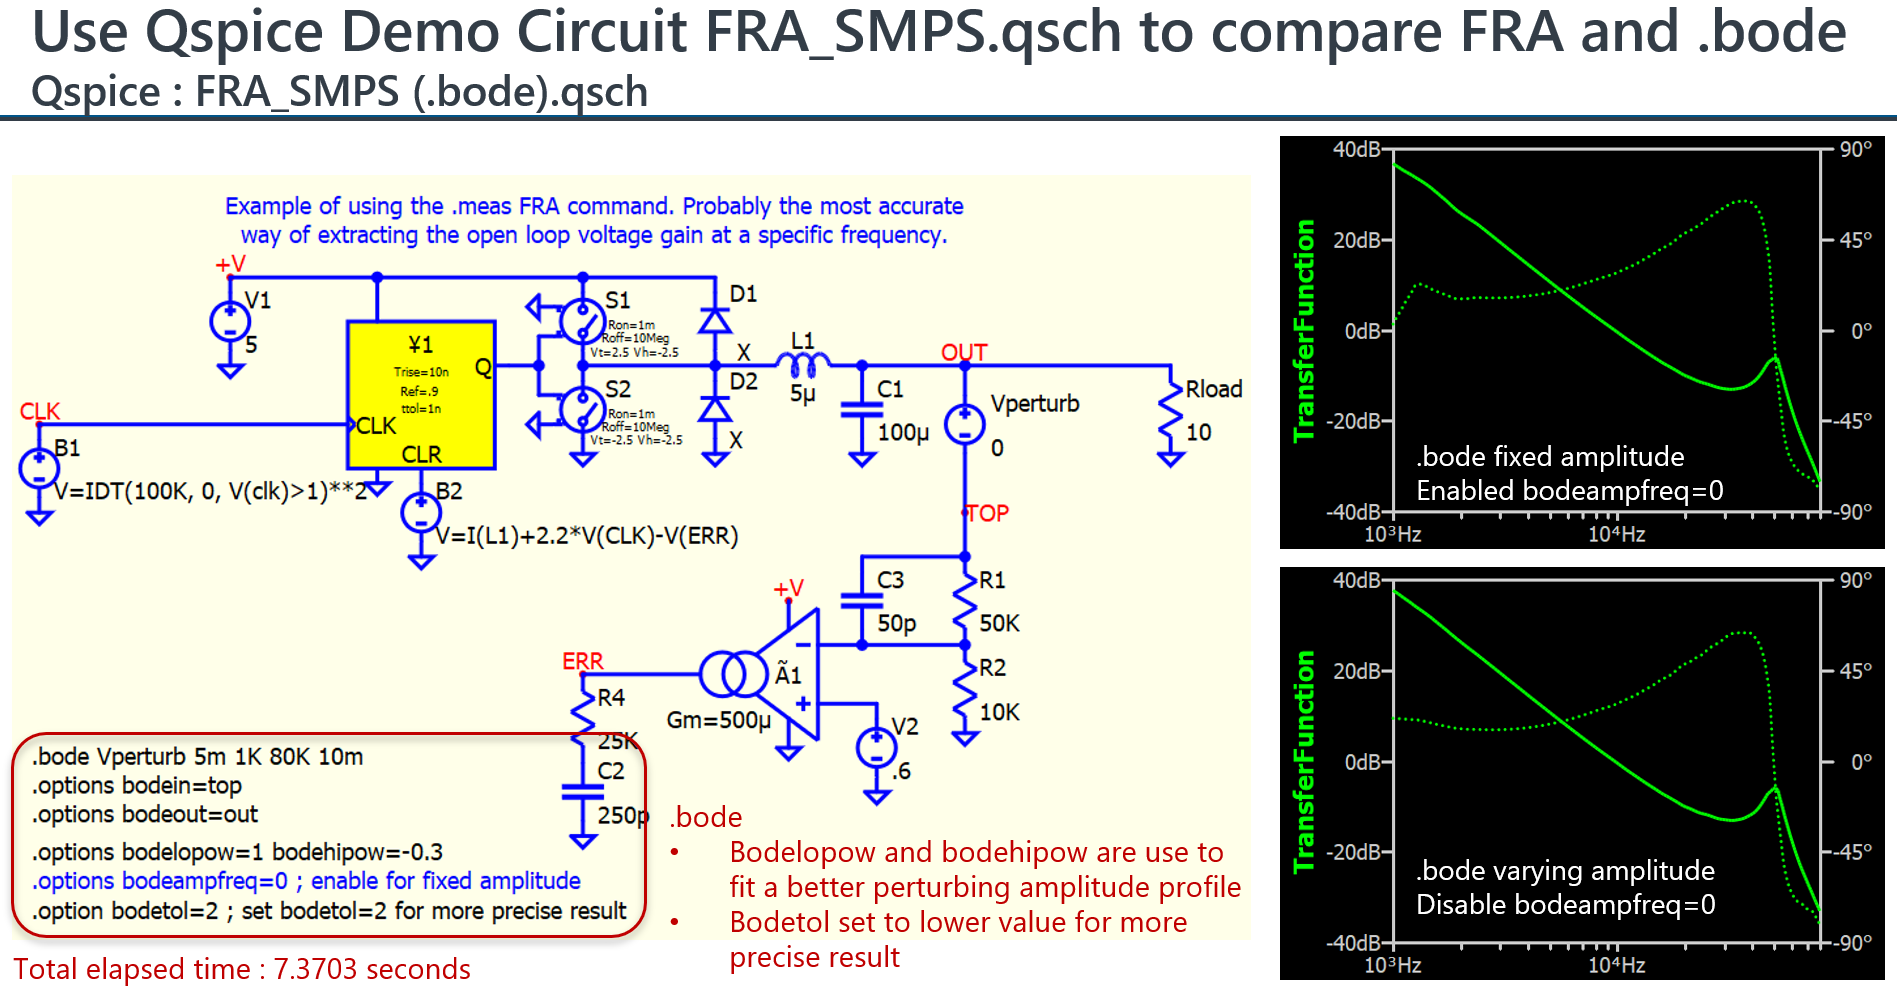
- in this simulation, need to force constant perturbating amplitude, use .option bodeampfreq=0. you have to prevent saturating output as it will no longer be small-signal frequency response
- .bode run very slow if Fstart to Fstop apart more than 3 decade. therefore, to sweep freq from 10Hz to 1GHz, I use .step to separate into 4 .bode sweeps and recombine the result