How does changing one component in an RF signal chain affect the performance of the complete system?
The Qorvo Cascade Calculator provides a quick way to explore that question by combining individual RF stages and calculating their overall system performance.
Within the broader design journey:
System Requirements → Component Selection → Impedance Matching → Hardware Validation
Cascade Calculator fits near the beginning of that journey. It can help you build an initial RF cascade, explore system-level tradeoffs, and better understand what each stage needs to contribute before moving into component selection.

What can you explore?
For each stage, enter four familiar RF parameters:
- Gain (dB) - amplification or loss through the stage
- Noise Figure - NF (dB) - degradation of signal-to-noise ratio
- P1dB (dBm) - the stage’s 1 dB compression point
- IP3 (dBm) - a measure of third-order linearity performance
Cascade Calculator combines those values and updates the resulting system gain, NF, P1dB and IP3 as you change the individual stages.
Getting started
There is nothing to download or install - the calculator runs directly in your browser.
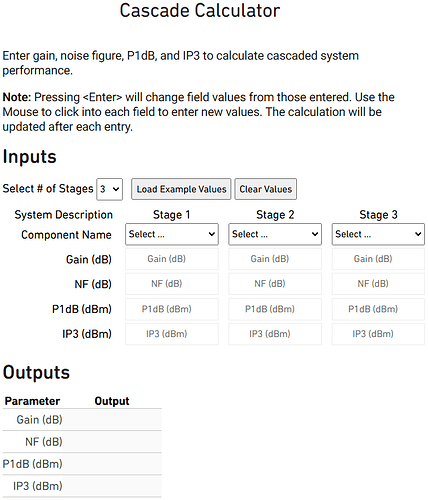
Choose the number of stages in your signal chain, select a component type for each stage, and enter the corresponding performance values.
Not sure where to start? Select Load Example Values and change one parameter at a time to see how it affects the overall cascade.
Tip: Positive gain represents amplification, while negative gain can represent loss through components such as filters or attenuators. P1dB and IP3 values in the calculator should be referenced to the output of each stage.
From cascade analysis to component selection
Cascade Calculator is most useful as an exploration and system-budgeting tool. The goal is to understand which stages are driving system performance and what each stage needs to deliver.
Cascade budget → Stage requirements → Product selection → Matching
Once those requirements are clearer, you can browse the Qorvo product portfolio for candidate devices.
For devices with available S-parameter data, the design can then move into tools such as MatchCalc™ for impedance matching before continuing toward hardware validation.
Want to learn more?
 Cascade Calculator
Launch the calculator and view the built-in step-by-step instructions.
 Facts About Noise Figure in 5G and Defense Systems
Learn more about noise figure and its impact on receiver performance.
The Importance of Input Linearity for Optimizing RF Receiver Designs
Explore the relationship between gain, NF, compression and linearity.
 Qorvo Design Tools Library
Explore additional Qorvo engineering tools.
Try it yourself
Open the calculator and try entering one of your own RF chains.
Which stage has the biggest impact when you change its gain, noise figure or linearity?
Share your chain, results or questions below.
For application-specific support, contact appsupport@qorvo.com.
Hands-on example: Build a simple receiver cascade
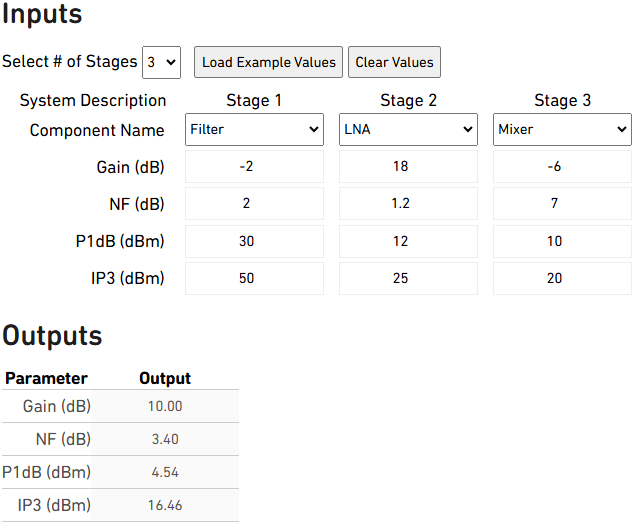
If you’re new to cascade analysis, here’s a simple example you can enter directly into the calculator.
| Stage | Component | Gain | NF | P1dB | IP3 |
|---|---|---|---|---|---|
| 1 | Filter | -2 dB | 2 dB | 30 dBm | 50 dBm |
| 2 | LNA | 18 dB | 1.2 dB | 12 dBm | 25 dBm |
| 3 | Mixer | -6 dB | 7 dB | 10 dBm | 20 dBm |
These values are illustrative examples for learning the calculator and are not specifications for particular Qorvo products.
Experiment with the chain
Once the values are entered, change one parameter at a time and watch the system output update.
- Change the first filter from -2 dB to -4 dB. What happens to the overall noise figure?
- Increase the LNA gain from 18 dB to 21 dB. How does the cascade change?
- Increase or decrease the LNA or mixer’s IP3. What happens to the overall linearity result?
Try changing the order of stages or replacing the example values with specifications from components you’re evaluating.
The important question is not whether there is one “correct” cascade - it’s which stages are driving the tradeoffs in your system.
Quick reference
Gain: Positive values represent amplification; negative values represent loss.
Noise Figure: A measure of the degradation in signal-to-noise ratio introduced by a stage. For a passive component, noise figure is generally comparable to its loss under standard conditions.
P1dB: The output level at which the stage’s gain has compressed by approximately 1 dB from its small-signal behavior.
IP3: A commonly used figure of merit for third-order intermodulation and RF linearity.
Continue the RF design journey
← Start Here: From System Requirements to Hardware
Next → Getting Started with MatchCalc™: From S-Parameters to a Matching Network