Hi
Is there a way to way to draw a graphical annotation such as a line directly on the waveform plot?
Thanks!
Hi
Is there a way to way to draw a graphical annotation such as a line directly on the waveform plot?
Thanks!
Soooo farrrr not yet!..
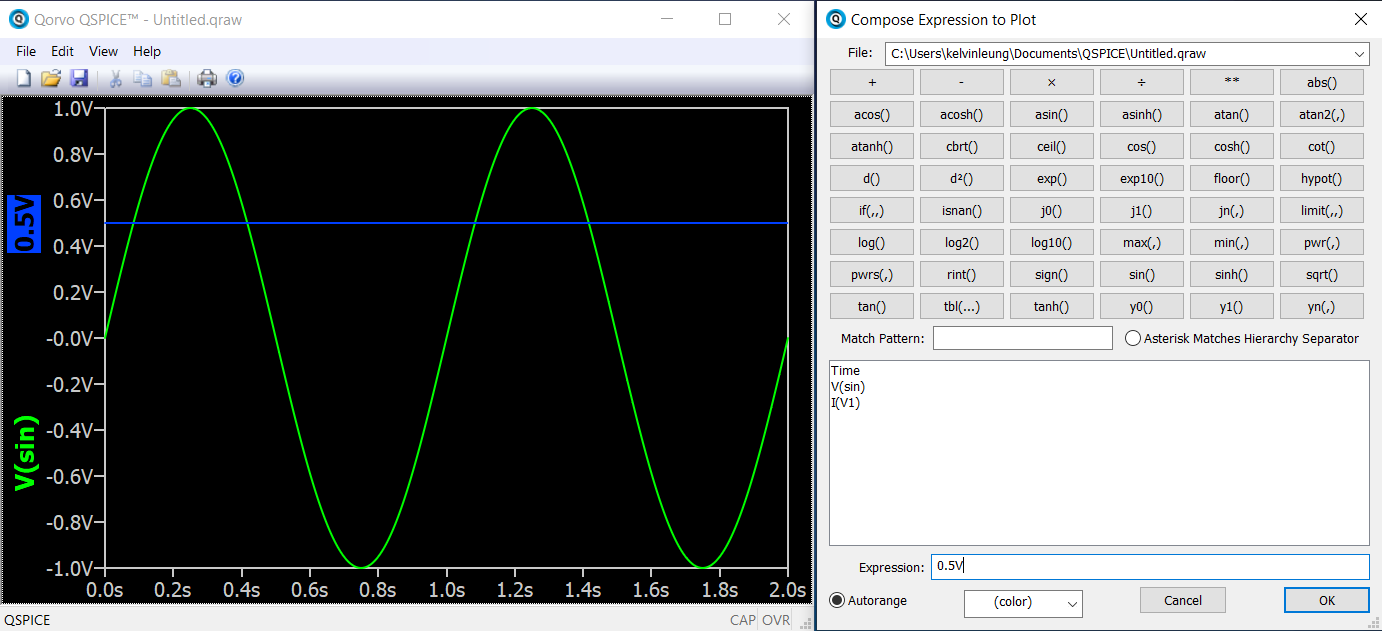
If you need to add a horizontal line, you can right-click, select “Add Plot,” and in the expression field, type the desired value along with its unit. This is the approach that most people commonly use.
Or, you can input a formula. But, Qspice currently does not have an option for graphical annotation in the waveform viewer.
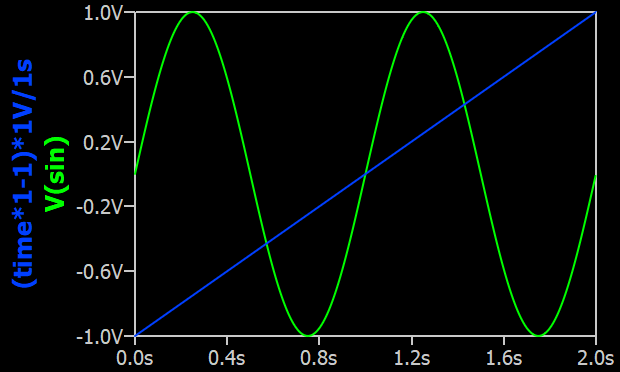
Not really practical for what I want to do. I like to draw load lines on transistor IV curves and so on, intersection points, etc… It is more of a visual thing rather than calculating the equation of a line to present the results.
I am really impressed by this simulator. The speed is out of this world. The plots look amazing, everything is amazing. I guess that after a while it will only get better and better, and annotations will be added at some point.
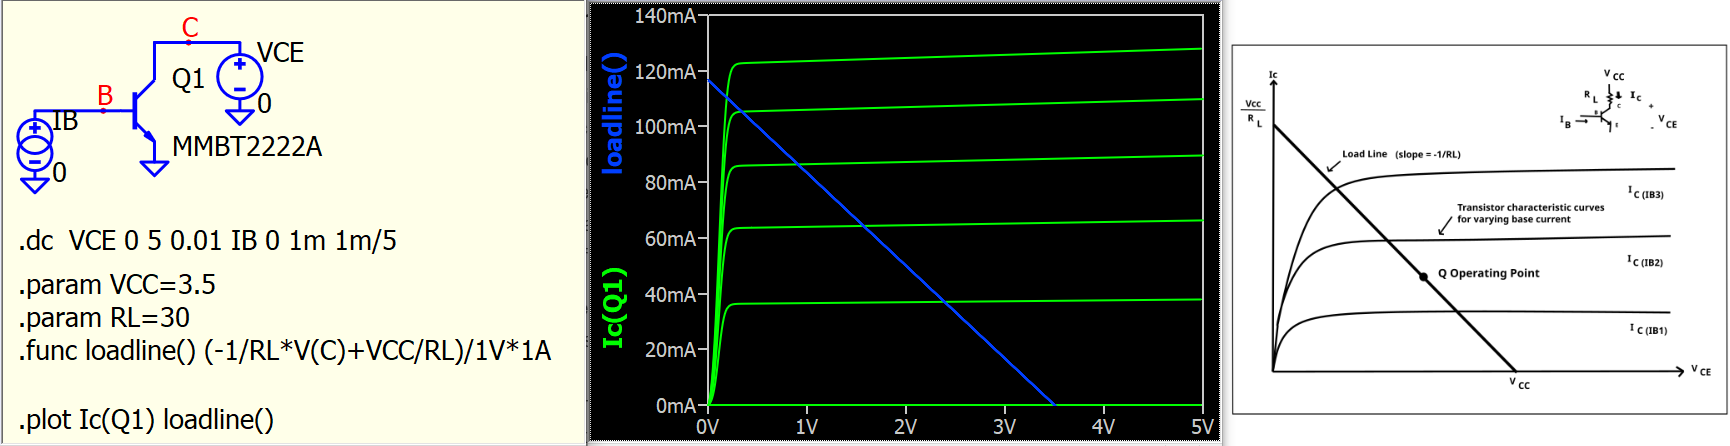
This is an example of loadline. For custom plot, possibly you have to consider using 3rd party program to handle that. There are project of python and matlab for Qspice in this forum.
transistor-loadline.qsch (2.9 KB)
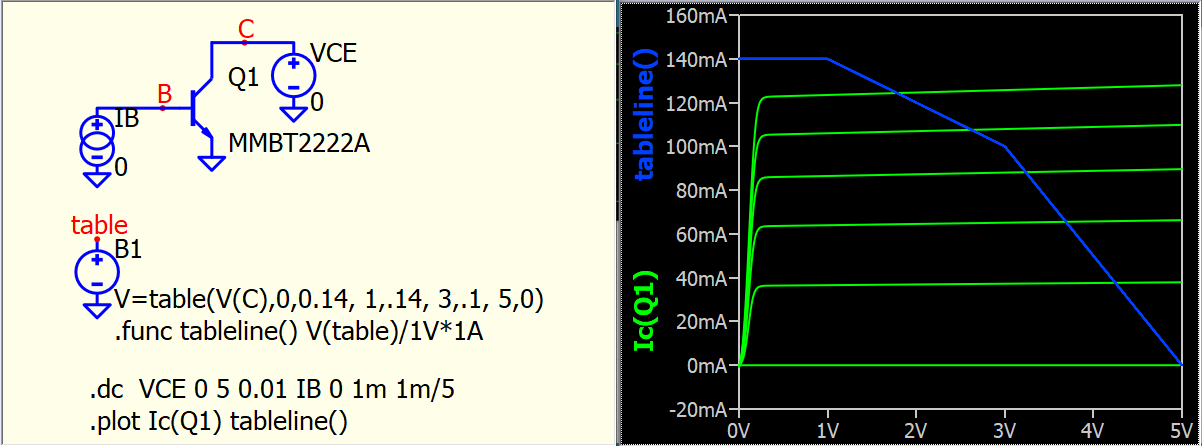
this is an idea to draw piecewise linear line
transistor-table.qsch (3.6 KB)
Hi, Analog_Joe:
I’ve asked Mike for a change that might get you part way to what you want.
You can copy a Waveform bitmap and insert it into the schematic. The annotation tools there, unfortunately, draw behind the bitmap. I’ve asked Mike to change the order and he sounded agreeable. Fingers crossed.
Of course, that’s imperfect and will have scaling problems. If you need better, see Printing Schematic To SVG -- Solved?
–robert
Thank you, Robert! That sounds like a good step forward. It will definitely help. I really appreciate you taking the time to help.
I think Mike has implemented the fix that I mentioned. Download the latest version and give it a try.
–robert