how to access internal C++ variables during debugging?
thank you
Fausto
QSPICE using verilator, so maybe debugging features from it would be helpful. You can always build shared library with debug symbols and apply to variables you have interest for watchers in f.e. VS debugger
Hi, Fausto.
It’s been a while since I did this but the trick is to load up the .DLL file as a project in MSVC (or whatever debugger), set your breakpoint(s) and tell the debugger it should launch QSPICE64.exe with the *.qsch as a command line option for debugging. That is, your running the QSPICE64.exe as a command line so no GUI.
–robert
Hi, Robert
Could you provide an example that describe the steps, I’ve tried in VS-code but failed.
-Peter
Hi, Peter.
See Compiling/Debugging C-Block Components With MSVS thread for links to step-by-step for Visual Studio.
But you asked about VS-Code instructions. VS-Code supports at least a couple of debuggers as add-ins. The exact steps would differ but should be similar to MSVS. I’ll take a quick look but no promises.
–robert
Hi again, Peter.
I gave it a quick attempt. It turned out to be pretty easy – at least for my configuration…
I have VSCode set up to compile DLLs using DMC, MS VC, and MinGW (gcc) toolkits. In particular, I have build configurations for both MS VC debug and release compiles. So I started with the MS compiler and debug configuration.
I tested with the QSpice schematic from the above linked MSVS debugging thread, i.e., a schematic called MyDemo.qsch containing a component for MyDLL. You must generate a netlist called MyDemo.cir and the component code (MyDLL.cpp) as described there.
At that point:
- Compile the MyDLL DLL with the MS compiler/debug configuration (see attached tasks.json).
- Create a debug launch configuration that runs QSPICE64.exe against MyDemo.cir (see attached launch.json).
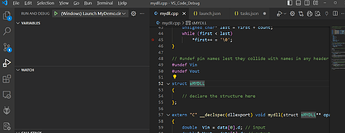
- With the MyDLL.cpp file open in the editor, set a breakpoint (click left of editor line numbers).
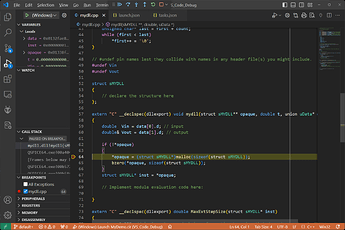
- Click the “Run and Debug” icon, select the launch configuration, and click run (green arrow/triangle).
That opens a terminal/command window in the foreground. Switch to the VSCode window and it’s stopped on the breakpoint:
Maybe this will get you started. Let me know if this was enough or if you have questions.
–robert
(Remove final “.txt”)
tasks.json.txt (2.6 KB)
launch.json.txt (486 Bytes)
Hi, Robert
Thanks a lot, the steps are very clear and helps a lot!
Now I have done with no error with .json you provided, but couldn’t stop at break point, just .cir run with terminal window popup(total elapsed time was shorter than true simulation which is about 0.03 seconds), and no simulation plot.

-Peter
Hi, Peter.
First, since this is running the simulation in batch mode, there will be no simulation plot. The data is saved (*.qraw, I think) which you can open from within the QSpice GUI or by double-clicking in File Explorer.
What compiler are you using?
Try doing a clean build – delete the *.dll and all other related files except for the *.cpp. Re-run the debug build. Review the compiler output to ensure that the build is has appropriate debug flags set for the compiler that you’re using. Maybe post that if it still isn’t working.
–robert
Hi, Robert
I tried again and succeeded with the 2nd MSVC compiler configuration in task.json, now everything goes well and can debug by step;
You are right, .qraw was generated when simulation down and can be viewed by QSpice.
Thanks!
-Peter
Excellent.
–robert


