Bad Z coordinate accuracy with LOS

Hi,
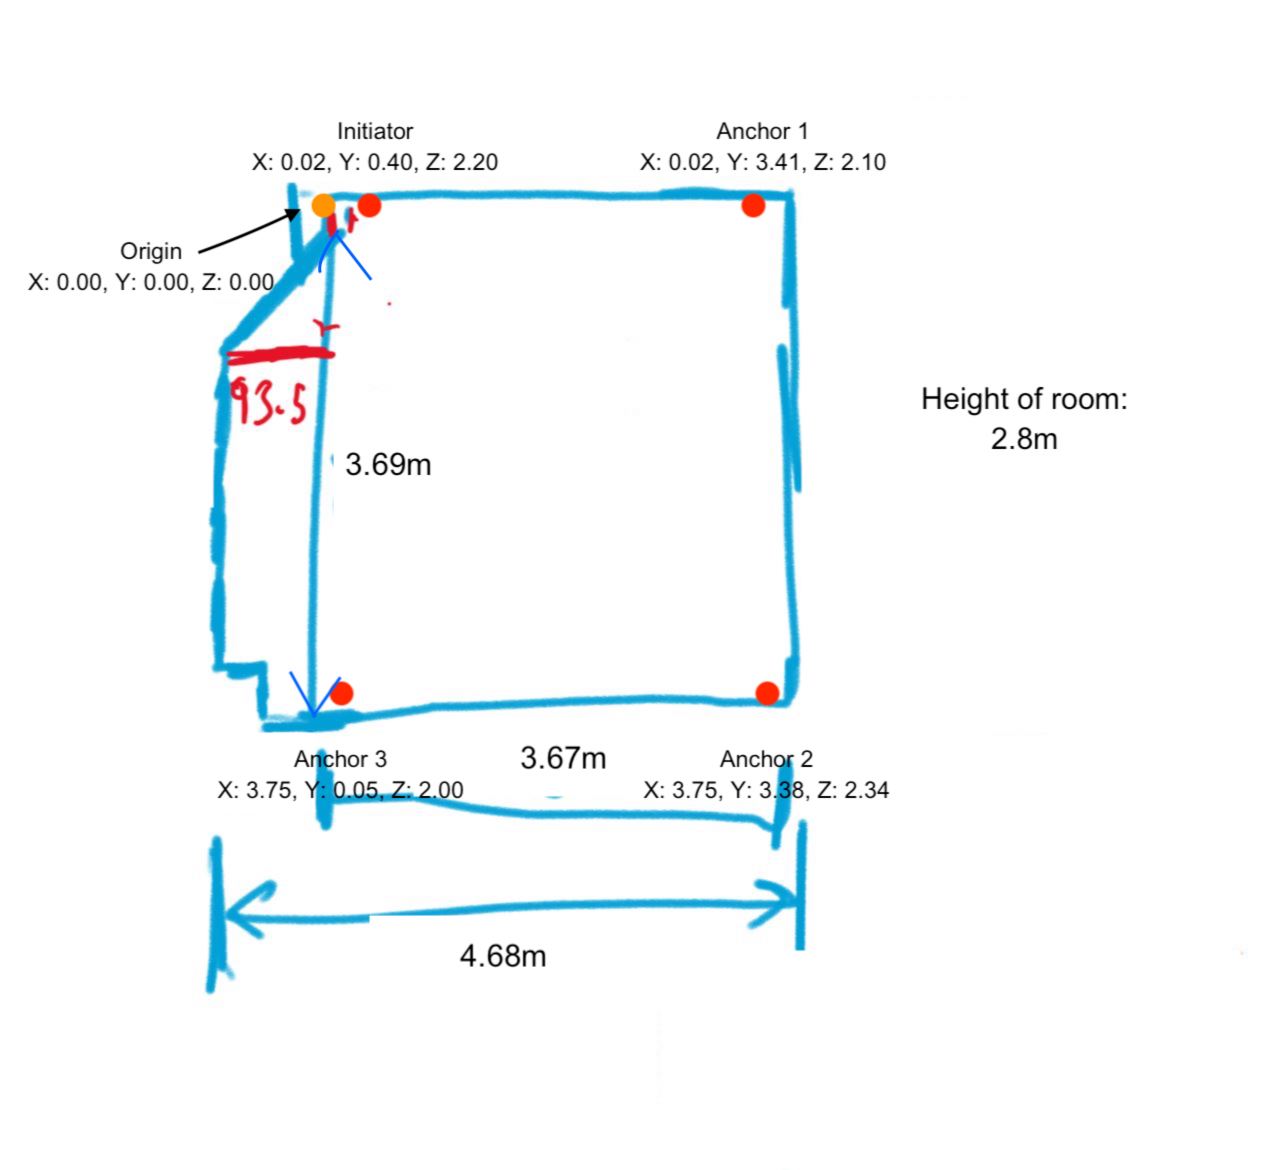
I set up a RTLS consisting of 4 anchors and 1 tag in my personal room in my apartment. The X and Y coordinates are okay but the Z coordinates are pretty unreliable. Most of the time LOS between tag and all 4 anchors exists. The tag’s height often is around 1.8m. Only in the center of my room I get kind of accurate Z coordinates.

I have a few objects in my room that have a metallic outside, e.g. TV, shelf, chairs, laptop and Desktop PC, lights etc. With LOS, metallic objects shouldn’t disrupt the location calculations, right? That’s what I at least got out of the documents in this post.
I know this is in general not a perfect environment for a UWB RTLS, but that’s actually what I want to achieve. I want to get as accurate positions as possible in a real-life environment (not a warehouse for example).

Please have a look into the schematics of my room attached below. All anchors have at least 40cm space to a wall.
I consider moving the anchors to the centers of each wall so that they are as evenly as possible distributed over the room.
Or, as I read in another topic, should I lower the Z coordinates of e.g. Anchor 1 and Anchor 3 to a much smaller value (1m)?.
What would give better results?

Or are there any other possibilities to tweak the Z coordinate? For my use case, a Z coordinate as good as the X and Y ones is needed.

Regards, Max

Hi there,
I think u have a problem with the GDOP - dilution of precision. Try to put down one anchor to the floor and try it again.
Btw to get better results on Z axis you need to have a good anchors placement but on a 3 meter room height (counting that you have objects in the way) gona be diifficult.
I did this just to evaluate GDOP on a LOS with your anchors coords.


As u can see the values on the VDOP, they have a mean value greater then the optimal GDOP coeficient - you can search this)…
(used your anchors coords in meters)
Hope i could help.

Cheers

Hey @ruigomes,
thanks for sharing your evaluation. But unfortunately, they still leave me a little confused.
By a higher mean value, do you refer to the light coloured squares in the top right corner of the VDOP chart? And why is the the bottom left square always dark? Does that mean that in this region I’ll get very bad results?

Anyway, I already updated my anchors’ positions as visible in the new schematics attached. Z coordinates are definitively better already but still not satisfactory. And right now, X and Y became a little worse. As next step do you think it would be useful to put an anchor on every wall? Or is it better to have two anchors on one wall and the other two anchors on the opposite one?

How did you compute and visualize this data? Is there a web service you used?

Regards, Max

I used python to make this map using the GDOP equations in my case and use it for guidance on anchors placement. (i was considering the tag was always at 1 meter from the ground to generate this colored map)
That i mean is that the mean value computed from me show a high mean value of coeficient around that squeme.
from your last anchors placement:
{
HDOP Mean: 1392.9528588703433 STD: 5446.208011141802
VDOP Mean: 35.117217052627815 STD: 76.331352786214
PDOP Mean: 7209.6898552581915 STD: 28947.566067488802
GDOP Mean: 7209.941284328529 STD: 28947.559679588034
} ,
Your new placement
{
HDOP Mean: 7.611393661900439 STD: 9.691977504804981
VDOP Mean: 2.4500614940372736 STD: 0.5277770628172062
PDOP Mean: 10.71268885486928 STD: 9.290803418609109
GDOP Mean: 10.910426864778044 STD: 9.407173745170955
}
and graph:


As you can see that are improvments - watch maximmun values.

This help me to understand for example that a 10 cm or 1 cm could have a greater impact on your position calculation with a high GDOP coeficiente. Improving this coeficient probably gona make that the errors from the ranges will not have greater impact on calculation the position.

Cheers.

Hi @ruigomes,
so after your scheme, a low mean in HDOP, VDOP, PDOP and GDOP indicates more reliable results, right?
That is, the “right” side of my room as seen from above in your scheme suffers from higher GDOP than the “left” side, and therefore location results on the “right” side tend to be worse, don’t they?

After all, a GDOP mean of 10 is considered to be quite unreliable anyway, right? Do you have any recommendations regarding my anchor placements? How about placing anchors on all 4 walls of the room?

And, if you like, would you share the code of your python visualizations? I am quite new to DOP and might need a little starter help.

Thanks for helping, Max

Hi @maxbauer,
Well, im on working on a thesis at this moment so now i dont have a lot to show and im already waiting some responses in some posts here too so I could actually advance more. Sorry :frowning:
But as far as i know, think like that GPS would work. Longer distances on satelites, a lot of dispersion and a lot of them dispersed around the earth. So as you could see, changing one anchor height could improve z but also affect the x and y. This is because (in my case) the method pseudo-ranges that computes positions dependes on ranges. Errors on each range will affect positively or negatively the calculation of the position.

So, imagine that you could move around the tag on your room always at the same height, what do you think would be the affectance on the position calculation. How the range spheres would be representable for your case. So if you need at least 4 ranges to calculate a x,y,z position. It is possible that mathematically results on a good position because all the erros could get “correlated” and there was a kind error of cancellation but not always gona be like that…

In my case there will be a lot of NLOS measurements or reflections and so even with a calibrated system, let just say 10 cm on error on each range, that error and with a bad DOP, 1 cm of error on a range could make a Z value like 8 meters of error (depending the height and x,y position of my devide )… So, on a room with a 3 meters height restriction… tricky…
Try just to test put them all on the roof and the tag always on the ground…

On the map i show you, it is possible to see that on the middle you will have better results on both H and V DOP but that doesnt mean that you have perfect results.
Here - Dilution of precision (navigation) - Wikipedia you could find an example how to compute and evalute the coeficient of the GDOP. With this you will understand why low coeficinent means that the results “may” be better. Dont forget this is an ideal case on LOS.

Hope i could help.
Cheers.

Hi @ruigomes,
all right, thanks for the clarification.

I’ll play around with the anchor locations and come back later once I’ve found the optimal set up.
I doubt though that placing the anchors on the ceiling improves Z coordinates… On the contrary, this will give very bad results as far as I know.

Regards, Max

Hi @ruigomes,

may I ask again for your support? Eventually I kept the anchor positions as explained above and now would like to compute and plot essentially the same GDOP data as you did it. Though I am struggling a bit to calculate GDOP because I couldn’t find any beginner friendly examples or tutorials for my use case. Tutorials often refer to GPS and longitude and latitude coordinates which is useless for me.
I was trying to compute GDOP values based on this tutorial here but my GDOP values often are complex numbers which seems wrong.

https://www.inventeksys.com/computing-dilution-of-precision-dop-for-gps/

This is my python code so far:

def calculate_dop(z):
# Define anchor coordiantes here
anchor_0_pos = [0.02, 0.20, 2.50]
anchor_1_pos = [0.02, 3.41, 1.30]
anchor_2_pos = [3.74, 3.48, 2.53]
anchor_3_pos = [3.74, 0.05, 0.70]

# Define reference position coordiantes here (reference positions are the positions for which you would like to calculate the DOP)
ref_0_pos = [1.0, 0.0, z]
ref_1_pos = [2.0, 0.0, z]
ref_2_pos = [3.0, 0.0, z]
ref_3_pos = [1.0, 1.0, z]
ref_4_pos = [2.0, 1.0, z]
ref_5_pos = [3.0, 1.0, z]
ref_6_pos = [1.0, 2.0, z]
ref_7_pos = [2.0, 2.0, z]
ref_8_pos = [3.0, 2.0, z]
ref_9_pos = [1.0, 3.0, z]

# 'anchor_pos' should have a length of 4 elements
anchor_pos = [anchor_0_pos, anchor_1_pos, anchor_2_pos, anchor_3_pos]
ref_pos = [ref_0_pos, ref_1_pos, ref_2_pos, ref_3_pos, ref_4_pos, ref_5_pos, ref_6_pos, ref_7_pos, ref_8_pos, ref_9_pos]

# Save calculated DOP values in these lists for later plotting purposes
GDOPs = []
PDOPs = []
HDOPs = []
VDOPs = []

for ref in ref_pos:
    A = []
    for anchor in anchor_pos:
        v_ref = np.array(ref)
        v_anchor = np.array(anchor)
        v = v_ref - v_anchor
        azimuth = np.degrees(np.arctan(v[0]/v[1]))
        elevation = np.degrees(np.arctan(v[2]/v[1]))
        A.append(np.sin(azimuth) * np.cos(elevation))
        A.append(np.cos(azimuth) * np.cos(elevation))
        A.append(np.sin(elevation))
        A.append(1.0)
    A = np.array(A)
    A = np.reshape(A, (4, len(anchor_pos)))
    C = np.linalg.inv(A.T * A)

    x_variance = C[0][0]
    y_variance = C[1][1]
    z_variance = C[2][2]
    time_variance = C[3][3]

    # Calculate dilution of precision properties
    GDOP = cm.sqrt(x_variance + y_variance + z_variance + time_variance)
    GDOPs.append(GDOP)

    TDOP = cm.sqrt(time_variance)
    
    PDOP = cm.sqrt(x_variance + y_variance + z_variance)
    PDOPs.append(PDOP)
    
    HDOP = cm.sqrt(x_variance + y_variance)
    HDOPs.append(HDOP)
    
    VDOP = cm.sqrt(z_variance)
    VDOPs.append(VDOP)

Can you maybe show me what my error is? That would be extremely helpful! Thanks

Max

Hey there!

I didnt run a script your’s.

I build it like this link: https://en.wikipedia.org/wiki/Dilution_of_precision_(navigation)

I did try to run your script and i found that the sqrt cometimes has a negative number to compute that raises a warning/error. (I dont know if that was your question about this script - sorry).

Because of that i change to this:
A = np.array(A)
A = np.reshape(A, (4, len(anchor_pos)))
B = A.T.dot(A)
C = np.linalg.inv(B)
and now i run all possibilities.

Is that what you where trying to achive?

Cheerz

Hey @ruigomes,

thanks for your answer. I actually found out by myself and implemented it the exact same way as you did. I don’t know though why the tutorial which I posted above explains it in such a different way…
But nevermind, it now works for me, too!

Thanks for your time
Max