Dear Sir
I want to obtain the gain plot while using the amplifier called TQP3M9036 at different frequencies like at 160Mhz, 4.8Ghz and in 1.2Ghz. I had attached the image of the circuit that I make on the Qspice software but I am unable to obtain the graph I am not sure whether the commands that I have given whether it is correct or not. Please could you help me to get rid out from this problem.
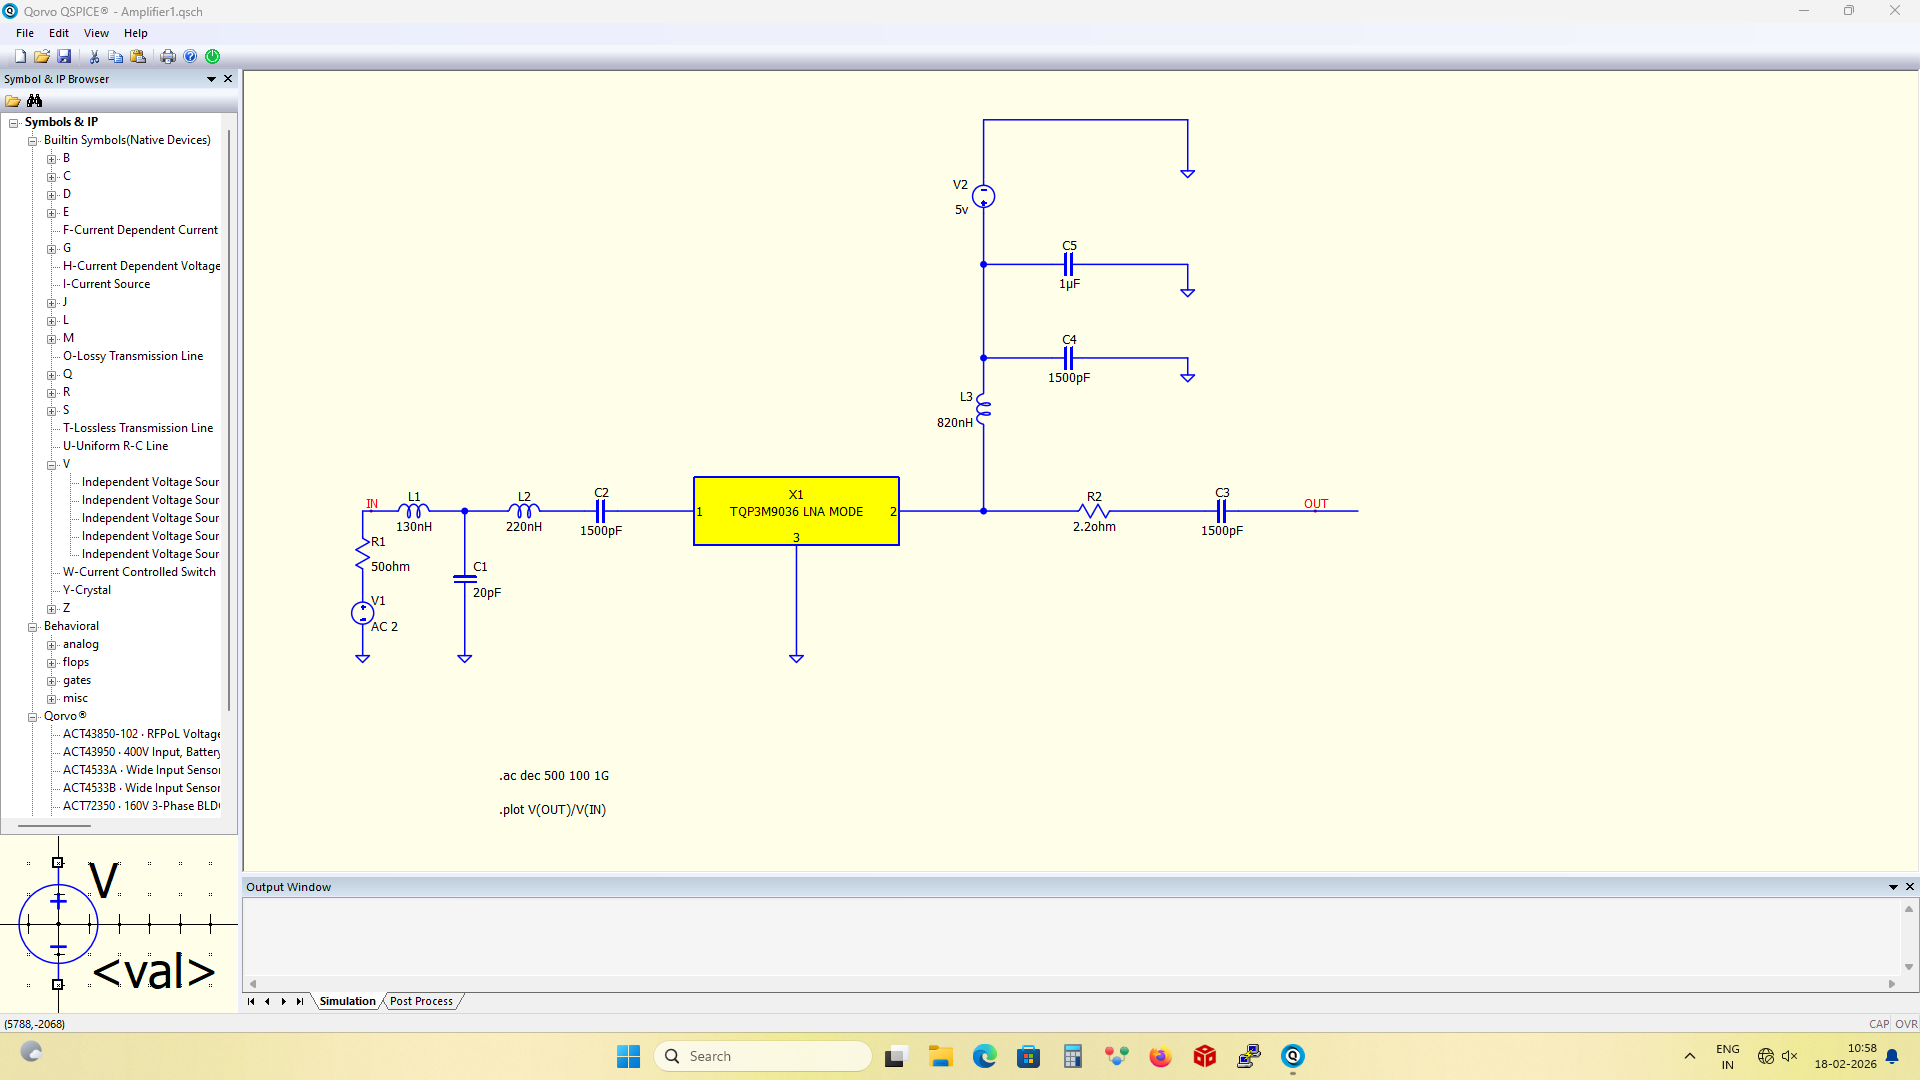
I assume you used the s-parameter file to generate the model and tried to simulate it. Did you change the name of X1 (you are not suppose to change that)? There is no way to identify what went wrong with your simulation without the .qsch file. Please refer to this post and consider increasing your trust level for schematic .qsch upload.
Qspice Forum - New User to Basic User (File Upload) - QSPICE - Qorvo Tech Forum
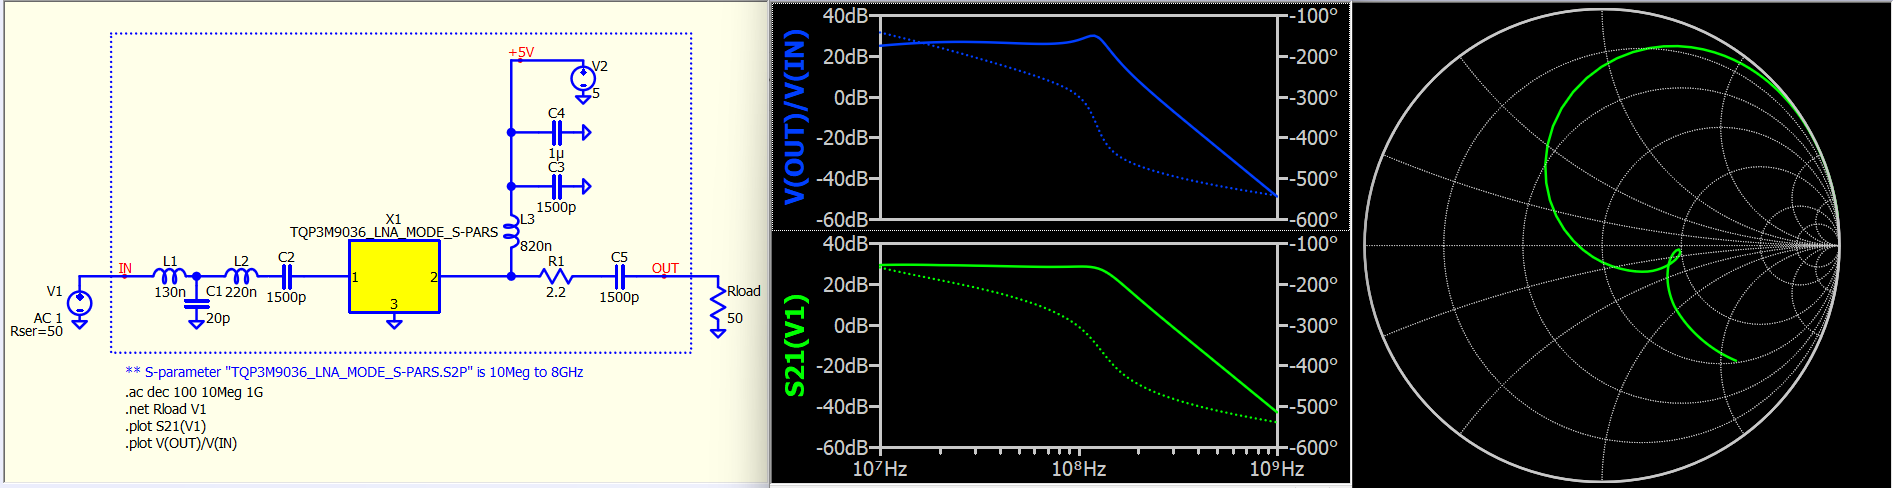
Why is nothing connected at V(OUT)? In general, you wouldn’t design something without a load, especially in RF circuit. If you are working in RF, possibly s-parameters analysis (.net) would be more helpful as you can get S11, S21, S12, and S22. Please note that the s-parameters model in Qspice only supports .ac analysis (frequency domain analysis) and not .tran (transient analysis). In this schematic setup, there is no difference in simulation results with and without the 5V power supply. The s-parameters (.s2p) of TQP3M9036 is from 10Meg, therefore, don’t simulate from 100Hz, as it is out frequency range of that s-parameter file.
example.TQP3M9036.qsch (94.8 KB)
Refer to this post if you want to learn more about .net in .ac analysis
.net Network Parameters simulation with Touchstone .s2p file - QSPICE - Qorvo Tech Forum