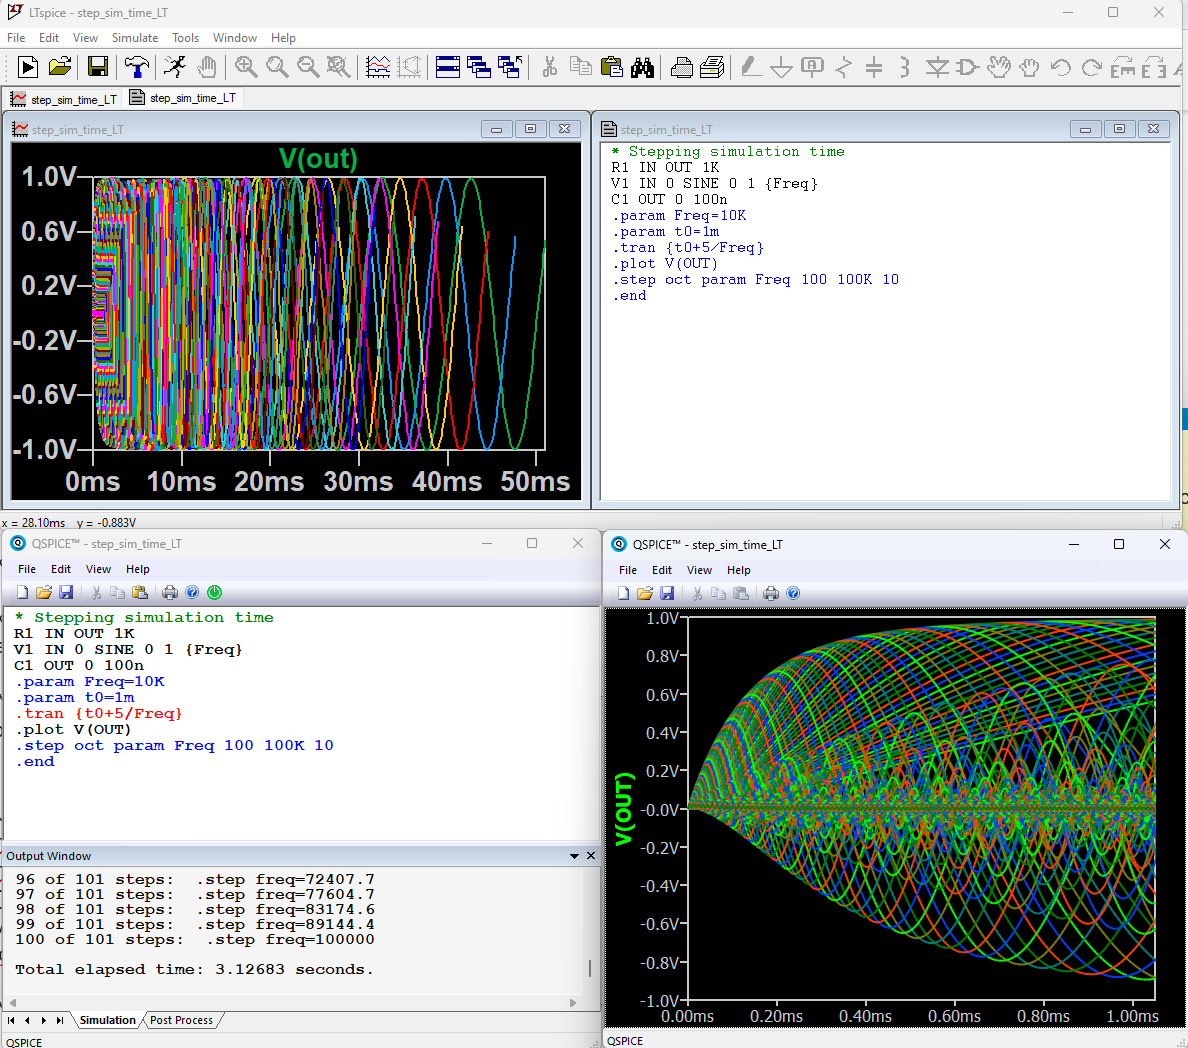
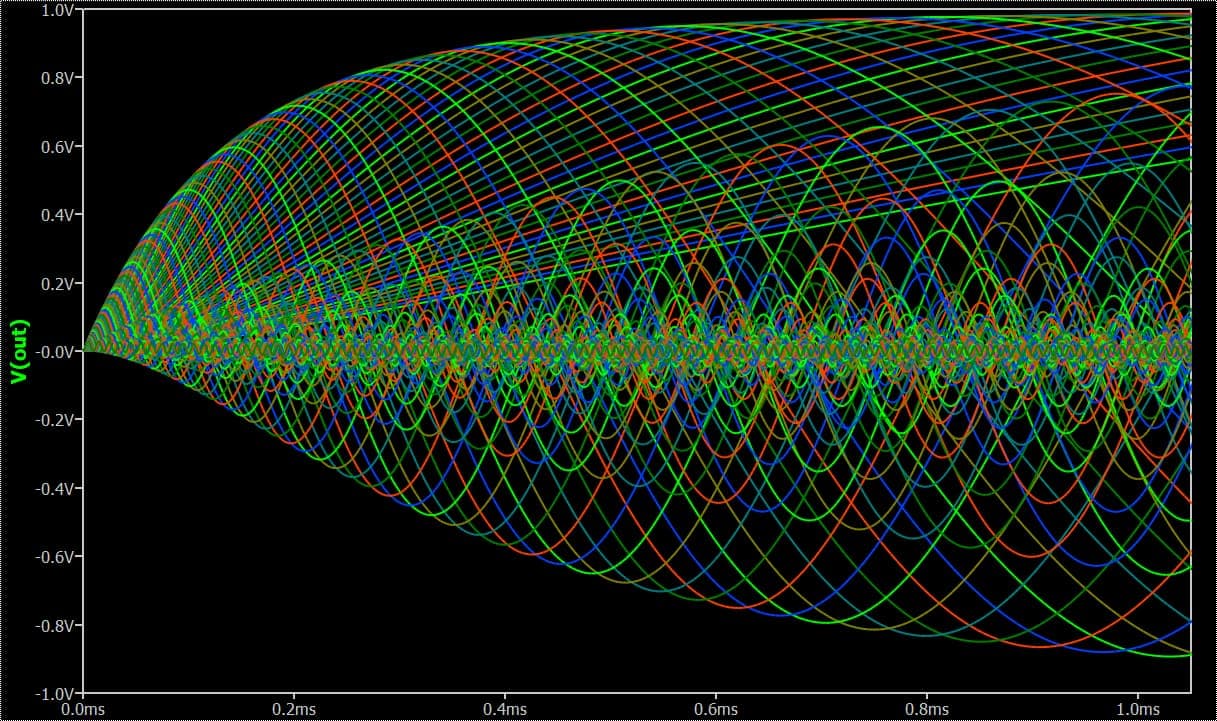
When stepping the simulation time, the waveform viewer can’t display correctly after simulation completed, only have the result from 0 to final tstop (in my case, it is 1.05ms). During simulation, i can see the result.
Looks like the increment updates aren’t working hard enough. If you resize during simulation it will probably be okay. Otherwise its really just trying to let you know it doing something.
Thanks for your reply. Can you try to simulate below netlist?
The result after 1.05ms are gone in QSPICE.
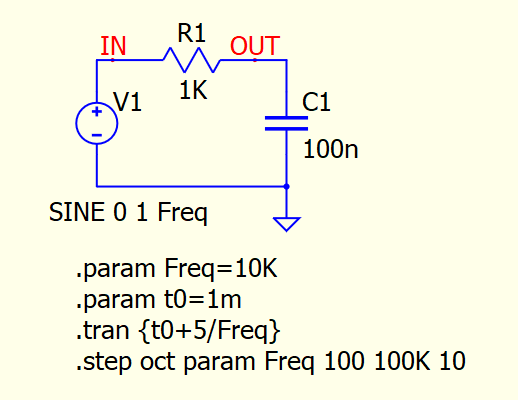
Stepping simulation time
R1 IN OUT 1K
V1 IN 0 SINE 0 1 {Freq}
C1 OUT 0 100n
.param Freq=10K
.param t0=1m
.tran {t0+5/Freq}
.plot V(OUT)
.step oct param Freq 100 100K 10
.end
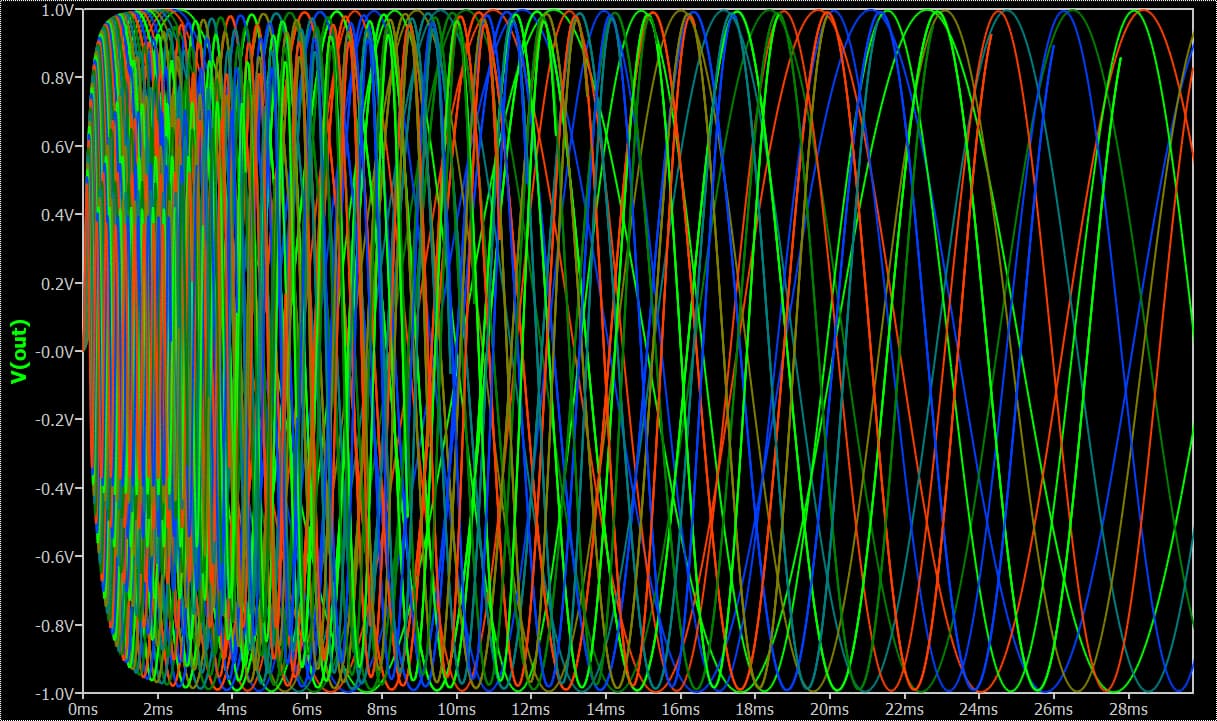
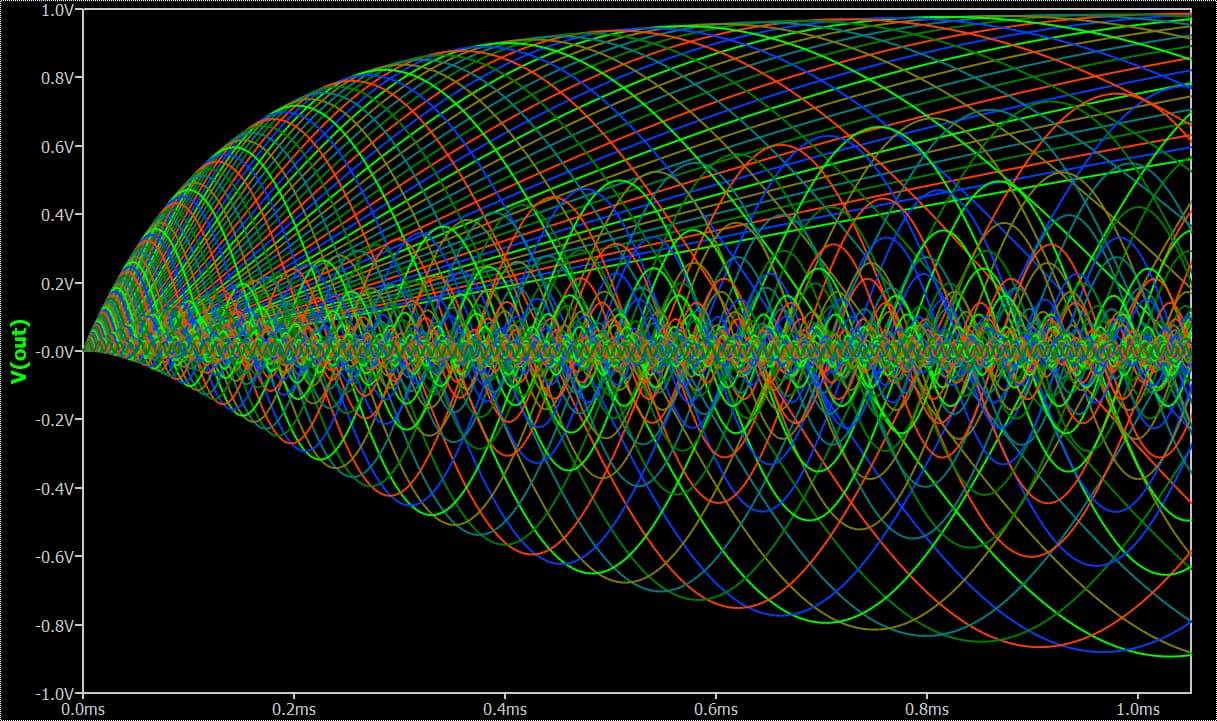
Below are the simulation result in QSPICE and LTspice with same netlist.
I updated the software and run the netlist, the waveform viewer shown all the result now.
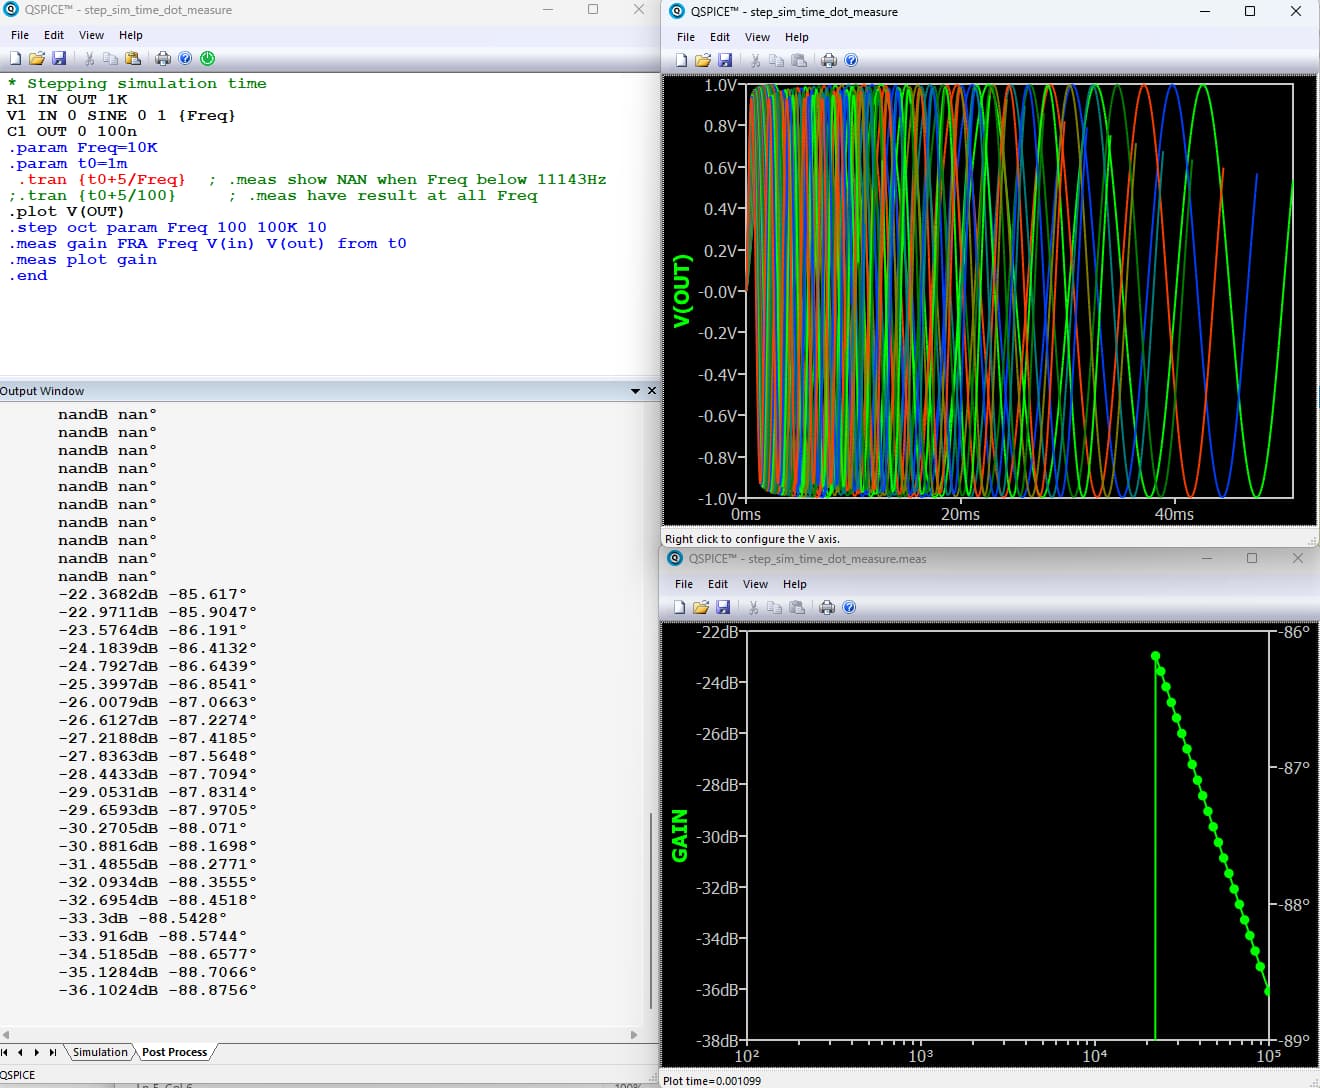
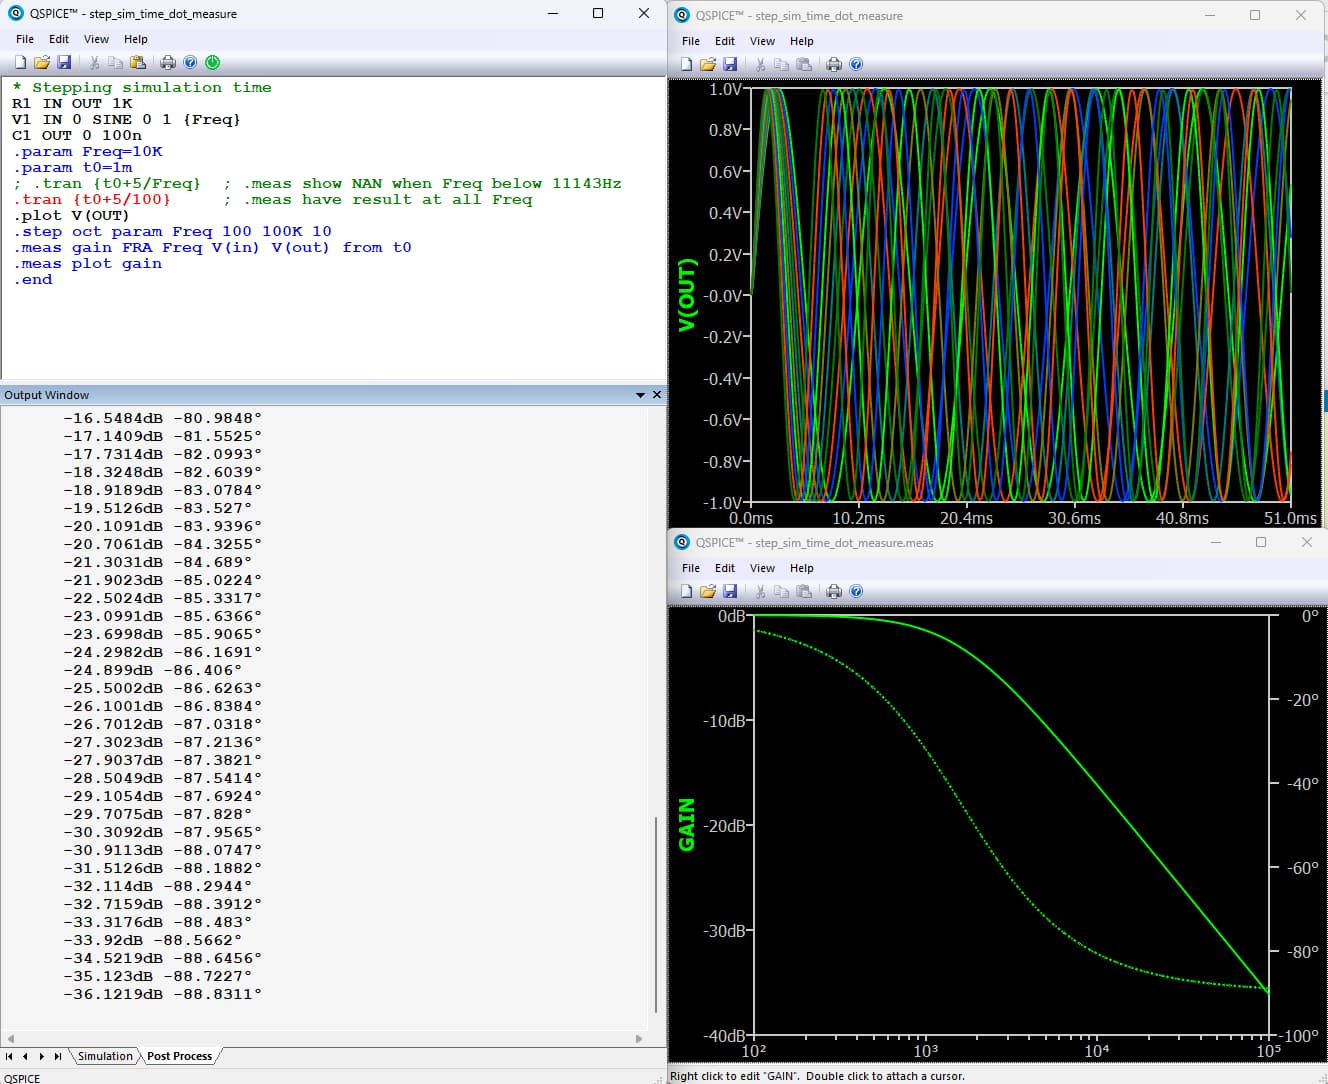
BTW, it seems the dot measure post processor also need to do the same thing.
Please see below two results.
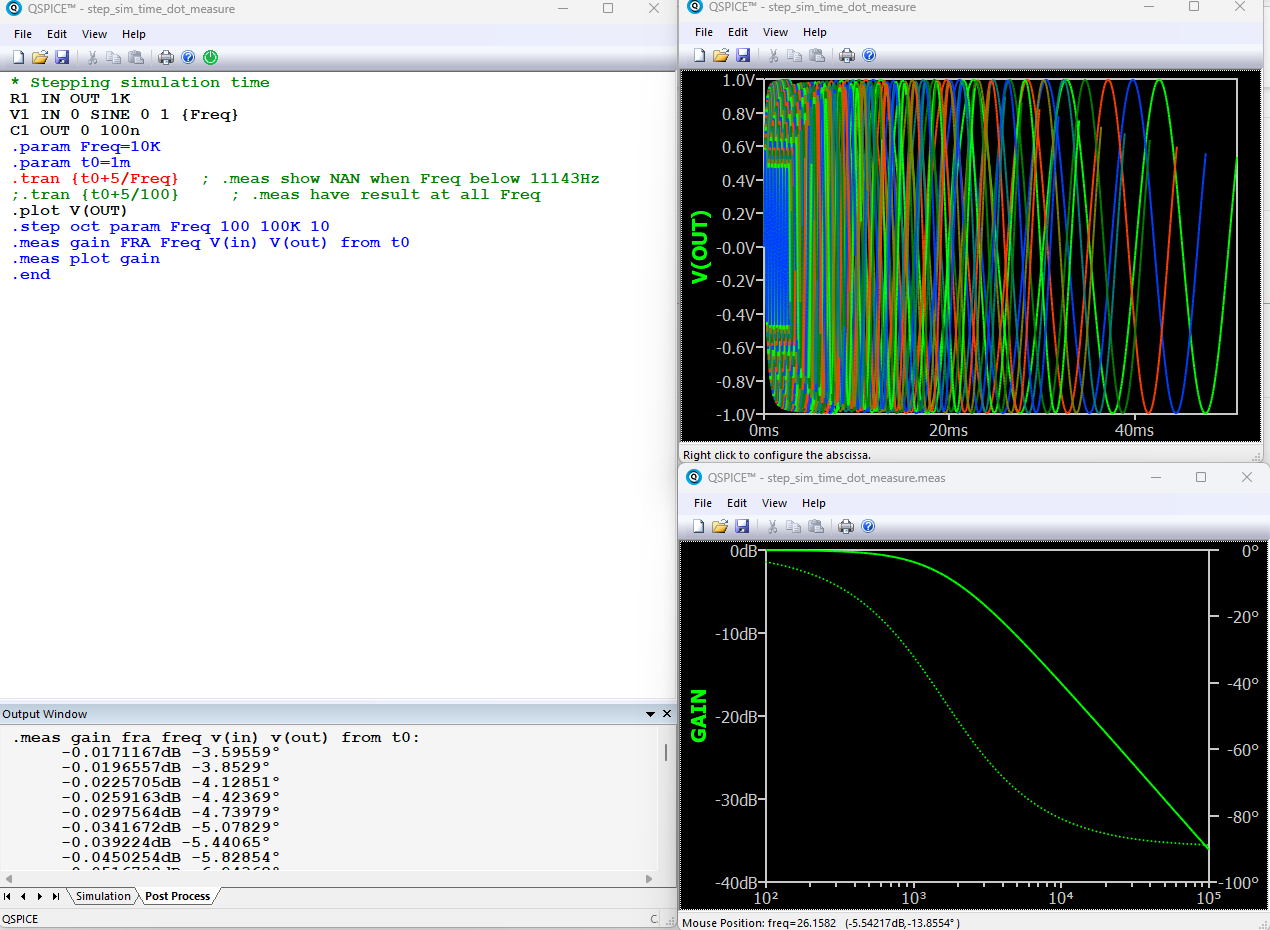
The first one is transient analysis with different end time (.tran {t0+5/Freq}), the post processor shown NAN when Freq below 11143Hz.
The second one is transient analysis with fixed end time (.tran {t0+5/100}), the post processor has results at each frequency step.
Stepping simulation time
R1 IN OUT 1K
V1 IN 0 SINE 0 1 {Freq}
C1 OUT 0 100n
.param Freq=10K
.param t0=1m
.tran {t0+5/Freq} ; .meas show NAN when Freq below 11143Hz
;.tran {t0+5/100} ; .meas have result at all Freq
.plot V(OUT)
.step oct param Freq 100 100K 10
.meas gain FRA Freq V(in) V(out) from t0
.meas plot gain
.end