When I run the simulation it is only plotting the first and last step. Doesn’t seem to matter how many steps I include. Is there something I am doing wrong or is this a bug?
1 Like
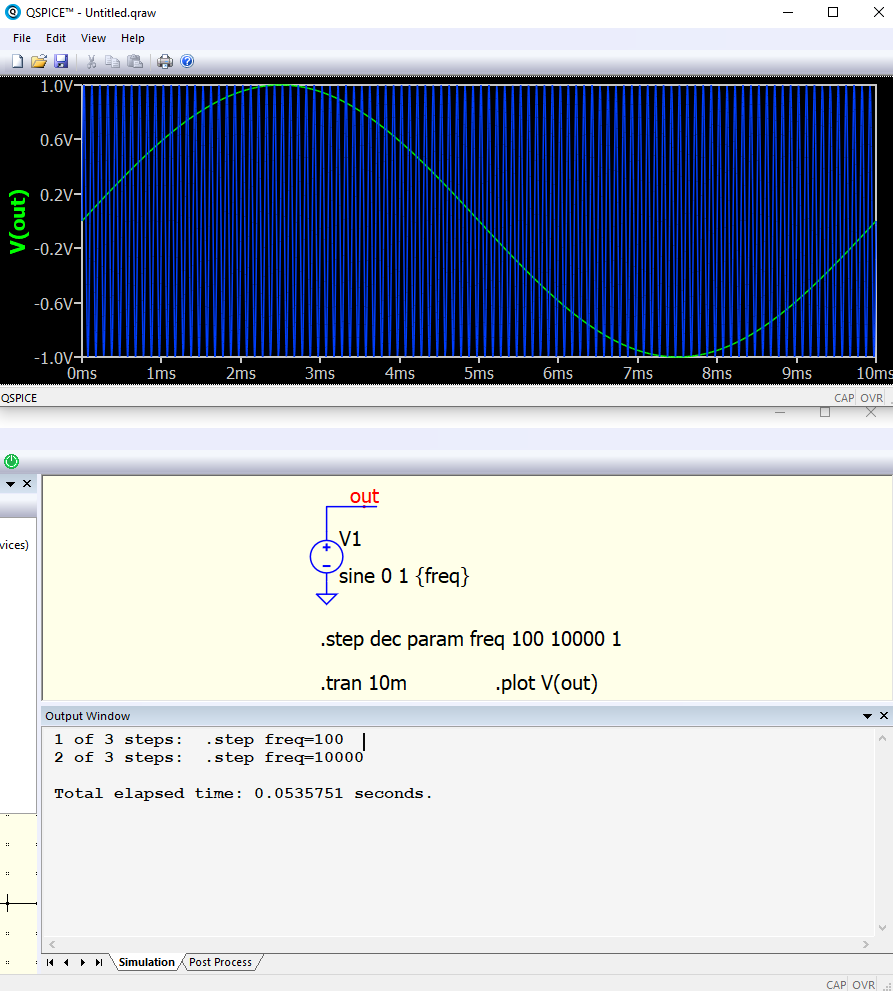
There should have been three waveforms.
.step dec param freq 100 10000 1
means 1 step per decade and three decades are requested. I changed the tolerance criteria for dec sweeps so if you update, you’ll see all three.
–Mike
Thanks you! Working correctly now.