Dear Mike, please consider adding single frequency analysis to QSPICE. You added a feature to LTSPICE which allowed ac sweep with just one frequency that calculated all voltages and currents with their phase angles. This is a particularly useful feature when working with linear ac circuits.
Kind regards,
Dr Bal Singh, Leeds Beckett University.
Dear Ivan,
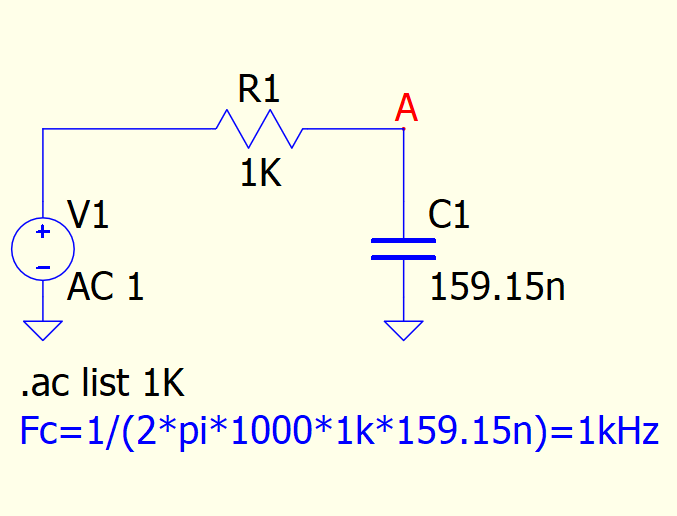
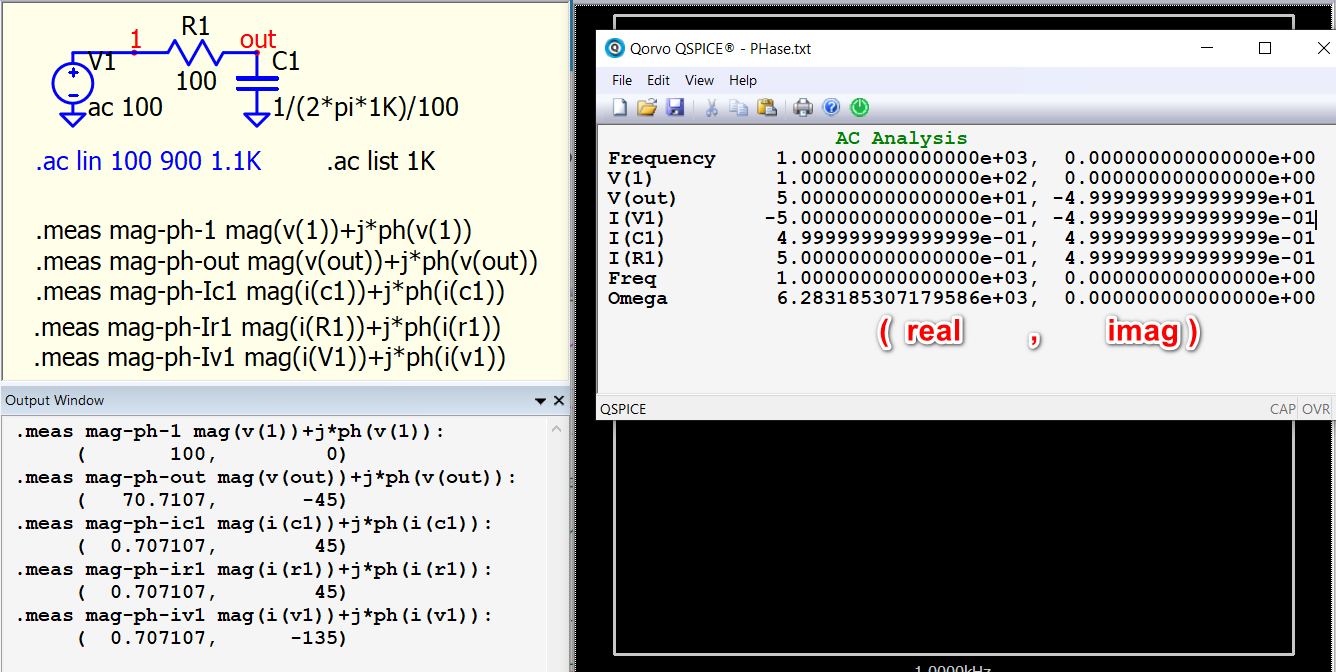
Thank you very much for a swift response. You are absolutely right, the suggested method works well and is a work around using waveforms. I am more interested in the output format as used in LTSpice as shown below. As the circuits get complex, the students start to struggle! In LTSPICE with just one command, you get all information. For example:
.ac list 1k
1 Like
Unfortunately, the FIND command does not work for a single frequency. Specifying FIND is very moody.
PHase.qsch (2.8 KB)
1 Like
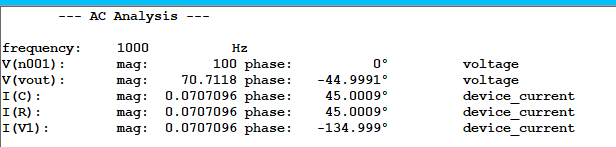
@Bal_Singh_LBU, It’s a bit tricky in Qspice. You can obtain a text file print all node voltage and current from Qspice after running a single frequency AC sweep, and in the waveform viewer: File > Export. However, Qspice currently only prints its default format for the phasor as (real, imag). It requires post-processing by the user to convert it into magnitude and phase using a third-party program.
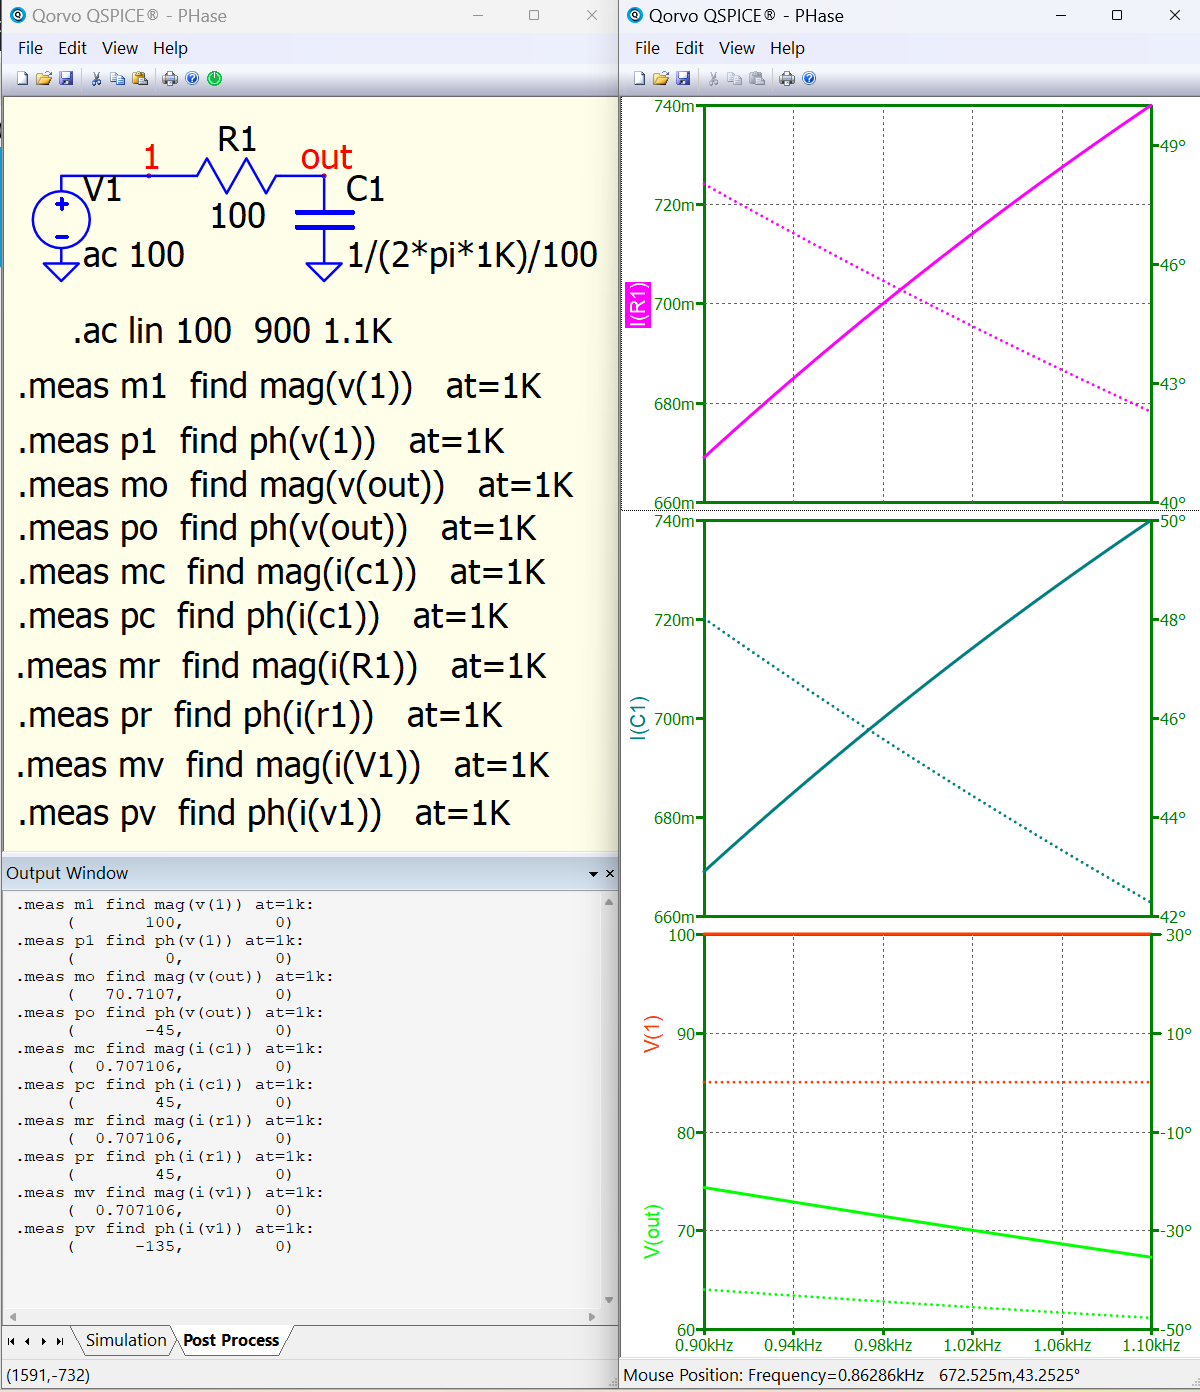
The method provided by @bordodynov can work with a single frequency with find and at removed. I can manipulate the format by setting the real part as magnitude and the imaginary part as phase, so that .meas can return a format like (mag, ph).
2 Likes
@KSKelvin, Thank you very much for the suggestion and work around. I wonder if something can be implemented in C code to eliminate extra steps? I’ll investigate and report back.
@bordodynov, Thank you very much for your suggestion. I am looking for something simpler like LTSpice for my students to use to get results with ease.
Before Mike consider to offer different data export format, you can consider this .m code.
This code (.m) can be run in Matlab or Octave to transform single frequency simulation data from rectangular to polar. Workflow is shown in code comment, and this is a screen capture of its result. I expect students in electronics to be able to handle Matlab/Octave; it would be beneficial for them to learn more.
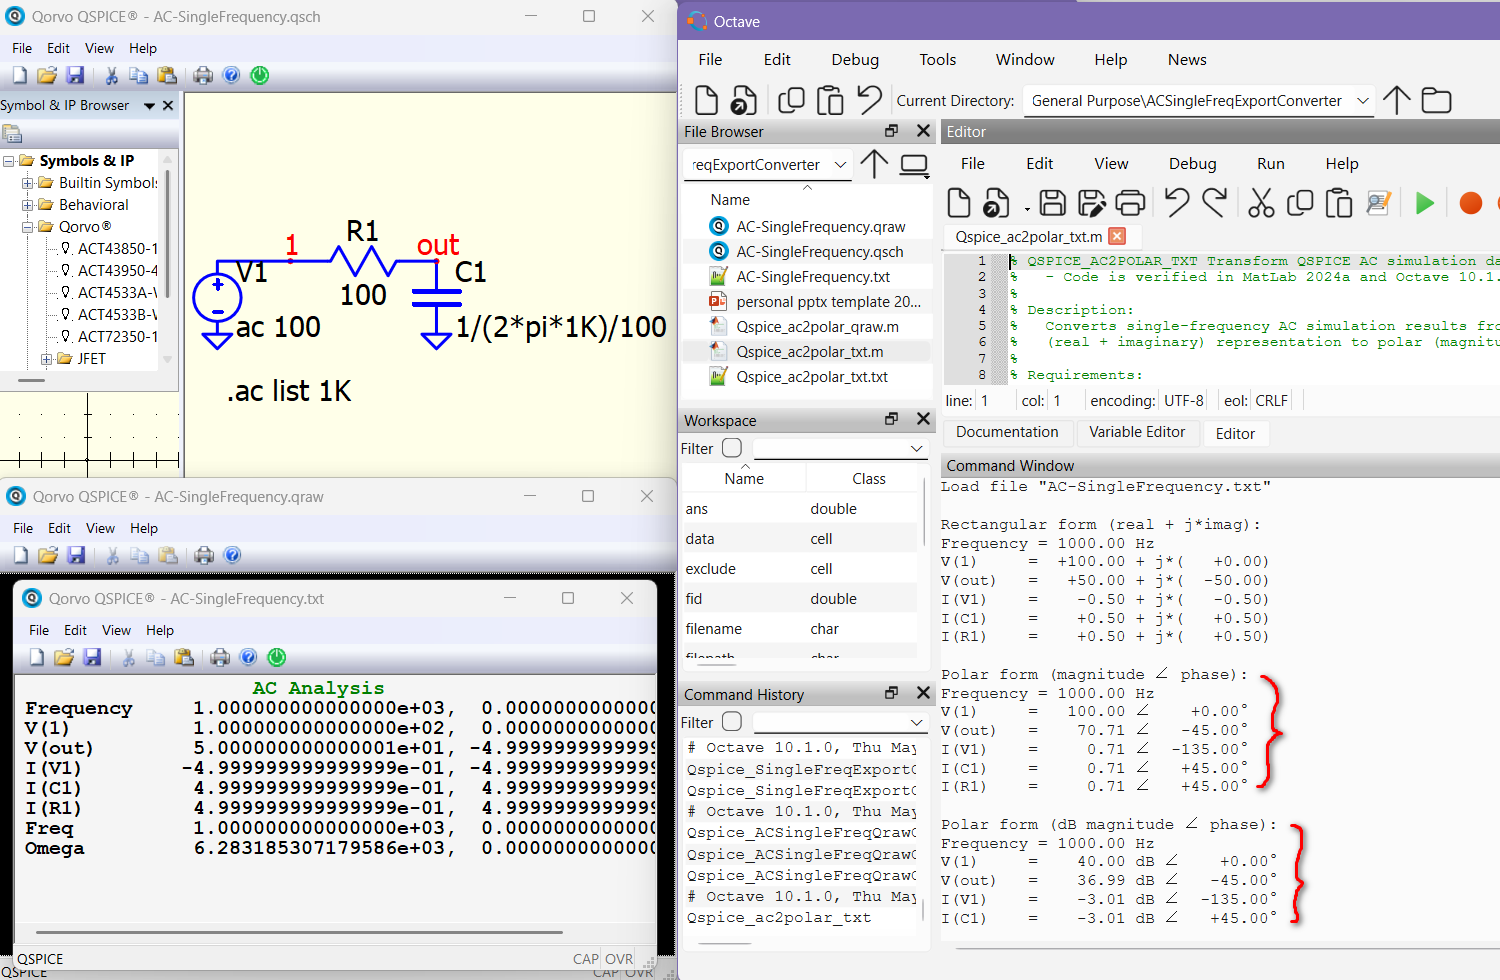
code of qspice_ac2polar_txt.m, copy and save as a .m file.
Or download from https://github.com/KSKelvin-Github/Qspice/tree/main/Matlab2Qspice/ac2polar-acSingleFreq . include a version to read .qraw directly, but it only can run in Matlab.
% QSPICE_AC2POLAR_TXT Transform QSPICE AC simulation data from rectangular to polar form
%   - Code is verified in MatLab 2024a and Octave 10.1.0
%
% Description:
%   Converts single-frequency AC simulation results from QSPICE from complex
%   (real + imaginary) representation to polar (magnitude + phase) format.
%
% Requirements:
%   - QSPICE simulation must use single-frequency AC analysis:
%       .ac list <frequency>  (e.g., .ac list 1kHz)
%
% Workflow:
%   1. Run AC simulation in QSPICE
%   2. In Waveform Viewer:
%       a. Select File > Export Data
%       b. Save results as .txt file
%   3. Run this MATLAB script and select the exported .txt file
%   4. View converted results in MATLAB Command Window
%
% Output Format:
%   Displays three representations of the data:
%   1. Rectangular form (real + j*imag)
%   2. Polar form (magnitude ∠ phase)
%   3. Polar form with dB magnitude (20*log10(mag) ∠ phase)
%
% Example:
%   Typical output format:
%       Frequency = 1000.00 Hz
%       V(out)    =   70.71 ∠  -45.00°
%       I(R1)     =    1.41 ∠   30.00°

clc; close all; clear;

% Get file and read first line
[filename, filepath] = uigetfile('*.txt');
fid = fopen(fullfile(filepath, filename));
firstLine = textscan(fid, '%s', 1, 'Delimiter', '');

% Check if AC Analysis file
if ~strcmp(firstLine{1}, 'AC Analysis')
    fprintf('%s is NOT Qspice AC Analysis, Abort!\n', filename);
    fclose(fid);
    return;
end

fprintf('Load file "%s"\n', filename);

% Read data (simplified parsing)
data = textscan(fid, '%s%f%f', 'Delimiter', ', ', 'MultipleDelimsAsOne', true);
fclose(fid);

% Organize data
exclude = {'Frequency', 'Freq', 'Omega'};
keep = ~ismember(data{1}, exclude);

txt = struct();
txt.trace = data{1}(keep);
txt.complex = data{2}(keep) + 1i*data{3}(keep);
txt.freq = data{2}(strcmp(data{1}, 'Frequency'));

% Display parameters
varWidth = 8;       % Width for variable names
numWidth = 8;       % Width for numbers
numPrec = 2;        % Decimal precision

% Display in rectangular form (real + imaginary)
fprintf('\nRectangular form (real + j*imag):\n');
fprintf('Frequency = %.*f Hz\n', numPrec, txt.freq);
arrayfun(@(n) fprintf('%-*s = %+*.*f + j*(%+*.*f)\n', ...
       varWidth, txt.trace{n}, ...
       numWidth, numPrec, real(txt.complex(n)), ...
       numWidth, numPrec, imag(txt.complex(n))), 1:numel(txt.trace));

% Display in polar form (magnitude and phase)
fprintf('\nPolar form (magnitude ∠ phase):\n');
fprintf('Frequency = %.*f Hz\n', numPrec, txt.freq);
arrayfun(@(n) fprintf('%-*s = %*.*f ∠ %+*.*f°\n', ...
       varWidth, txt.trace{n}, ...
       numWidth, numPrec, abs(txt.complex(n)), ...
       numWidth, numPrec, rad2deg(angle(txt.complex(n)))), 1:numel(txt.trace));

% Display in polar form with dB magnitude
fprintf('\nPolar form (dB magnitude ∠ phase):\n');
fprintf('Frequency = %.*f Hz\n', numPrec, txt.freq);
arrayfun(@(n) fprintf('%-*s = %*.*f dB ∠ %+*.*f°\n', ...
       varWidth, txt.trace{n}, ...
       numWidth, numPrec, 20*log10(abs(txt.complex(n))), ...  % Convert to dB
       numWidth, numPrec, rad2deg(angle(txt.complex(n)))), 1:numel(txt.trace));