The information is missing from foot of the viewer.
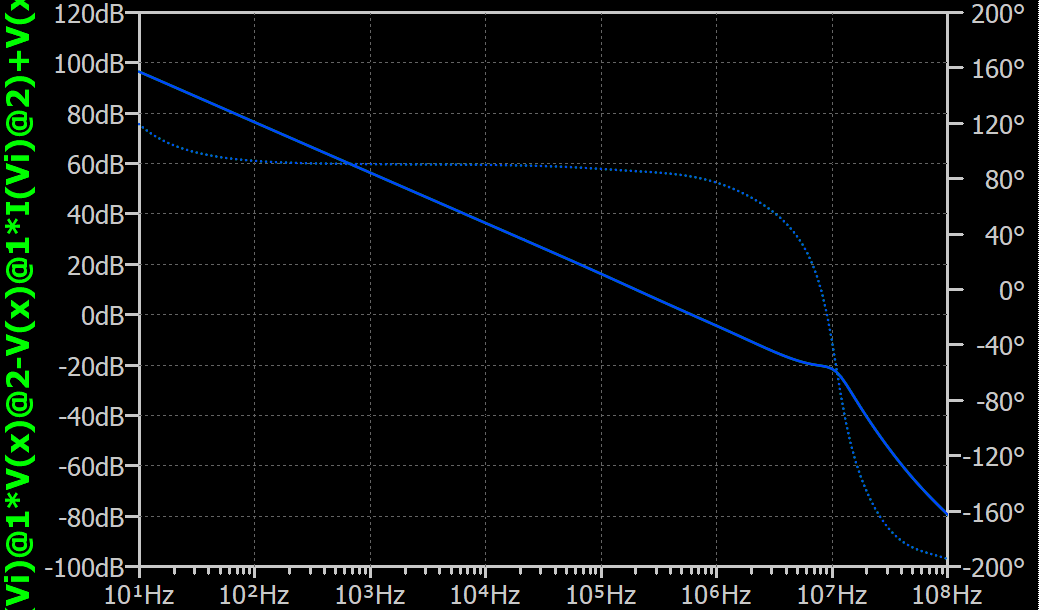
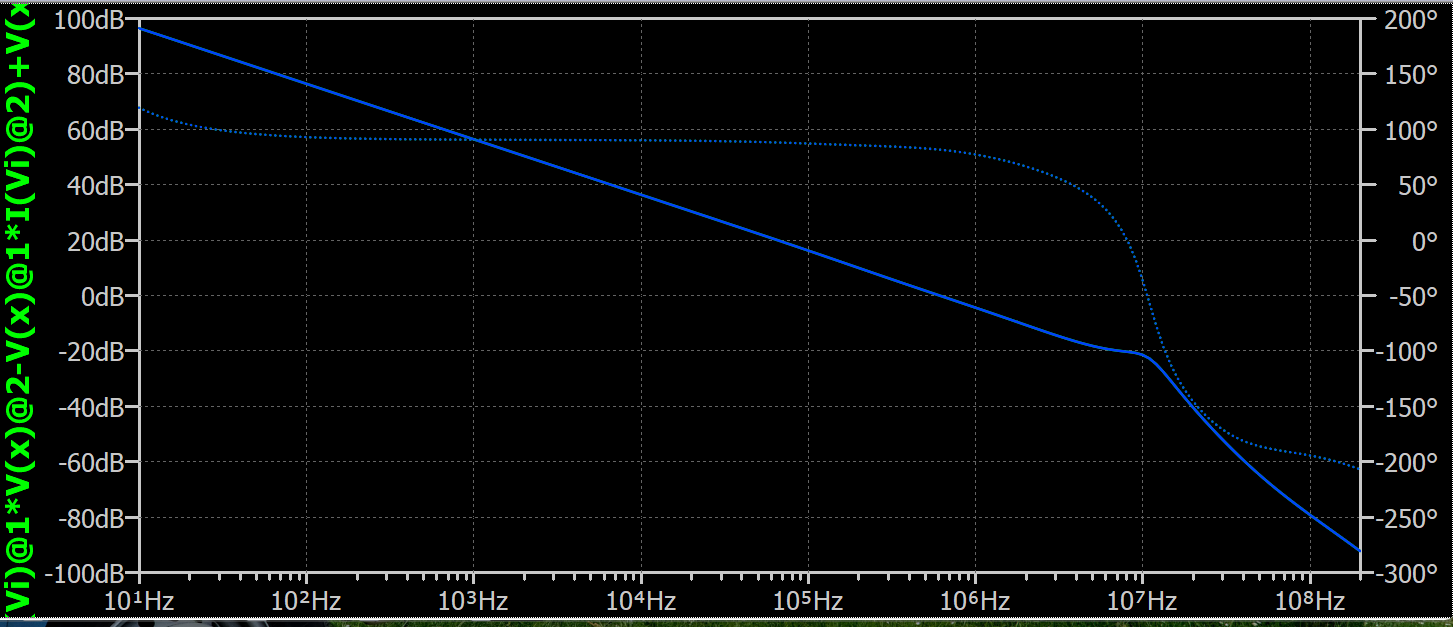
The issue of a Bode plot measurement altering when pressing rerun with the viewer open is confusing. I’d like to ask what I can do to mitigate this. I’ve uploaded images. Do I take the first sim run as trusted or do I take the rerun as trusted?
Regards.
Terry
Double-click on the trace label and read the value from the cursor to identify which one is correct. Be aware that the frequency in the first plot goes up to 1e8Hz and the second plot goes up to 2e8Hz, that why the value of rightmost look different, as frequency is different. It’s possible that the waveform viewer sets its y-axis limit differently on rerun.
Bug reports via email; you can find the email in Qspice > Help > About. It would be best to attach your schematic and provide steps on how this issue can be recreated.
Thank you.
I believe the cause was Newton iterations wander. Adding ESR to pair of Caps stopped that behavior.
Regards,