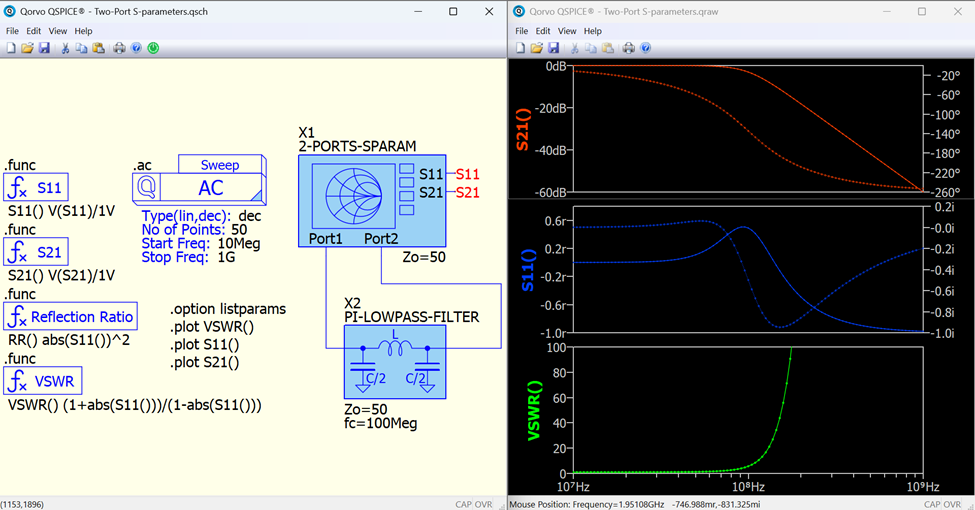
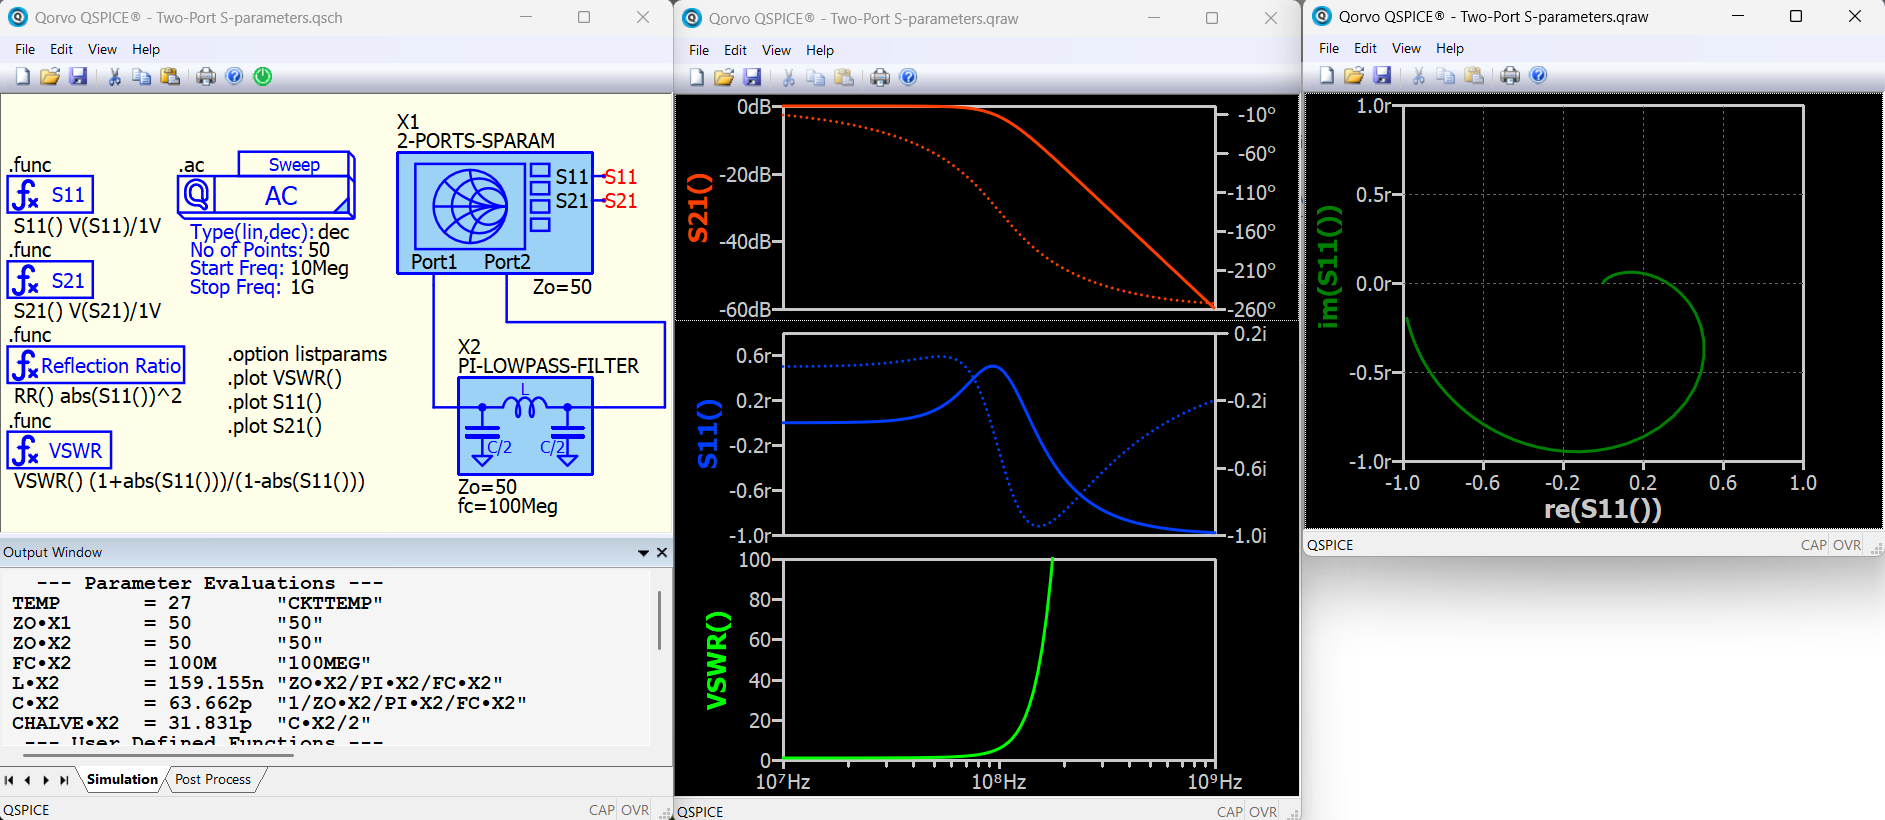
For this week’s QSPICE® schematic capture, we have "Two-Port S-Parameters” by our friend Kelvin Leung. “This is a schematic that demonstrates the use of QSPICE to compute S-parameters. In addition to simulation, this example also showcases the powerful graphical custom symbols and parameter evaluation within subcircuits in QSPICE. Discussion on the S11 and S21 measurement techniques in SPICE can be found in the QSPICE forum, where I have created a custom symbol that eases the simulation setup.
Furthermore, the PI-type Low Pass filter is also a custom symbol. By inputting only the characteristic impedance and cutoff frequency, it computes the L and C values within the subcircuit and displays their values in the Output Window, simplifying the design process. This example can be run with this standalone schematic.
(**Note: Please run this schematic together with the plot config file .pfg in the same directory. I have set up the plot config so that S11 and VSWR look better. QSPICE’s default polar (dB, degree) format is not quite suitable for these parameters. It is also possible to plot S11 into SmithChart coordinate, but needs more setup in waveform viewer, just included in screen capture.)"
For those interested in obtaining these symbols for their projects, they can be found on KSKelvin’s GitHub: https://github.com/KSKelvin-Github/Qspice
Please send any submissions to tim.mccune@qorvo.com. (Schematic Capture Post #055)