I would like to inquire about how to customize the magnetization curve in QSPICE when simulating saturable inductors. The default model seems to be S-shaped, but I need a Z-shaped curve. Is there any tutorial available to guide me on this?
I have a Device Reference Guide in my Github you can download, and you can search for L. Inductor section for topic related to non-linear inductance. Isat, Lsat, Satfrac are instance parameters for non-linear inductance modeling, OR you can use flux model. Both with examples in this guide. But I am really not sure if it can help you for Z-shaped inductance curve.
Qspice/Guideline/Qspice - Device Reference Guide by KSKelvin.pdf at main · KSKelvin-Github/Qspice
Thank you for your reply, the information provided was very useful. I wonder if you have any more theoretical materials that introduce how the equivalent circuit model of inductors is derived. This would be very helpful for me to grasp how to set these parameters to fit the waveforms from my actual measurements. Thank you!
I actually tested the inductance voltage as a square wave, but the simulation always shows spikes, which seems to be caused by the inductance current changing too quickly. How can the inductance current be slowly increased, and immediately saturated beyond a certain level, as shown in the figure.
I’m not sure if I understand the situation correctly. If you are setting up a simulation to test an inductor with a square wave, there are at least two things that need to be taken into consideration.
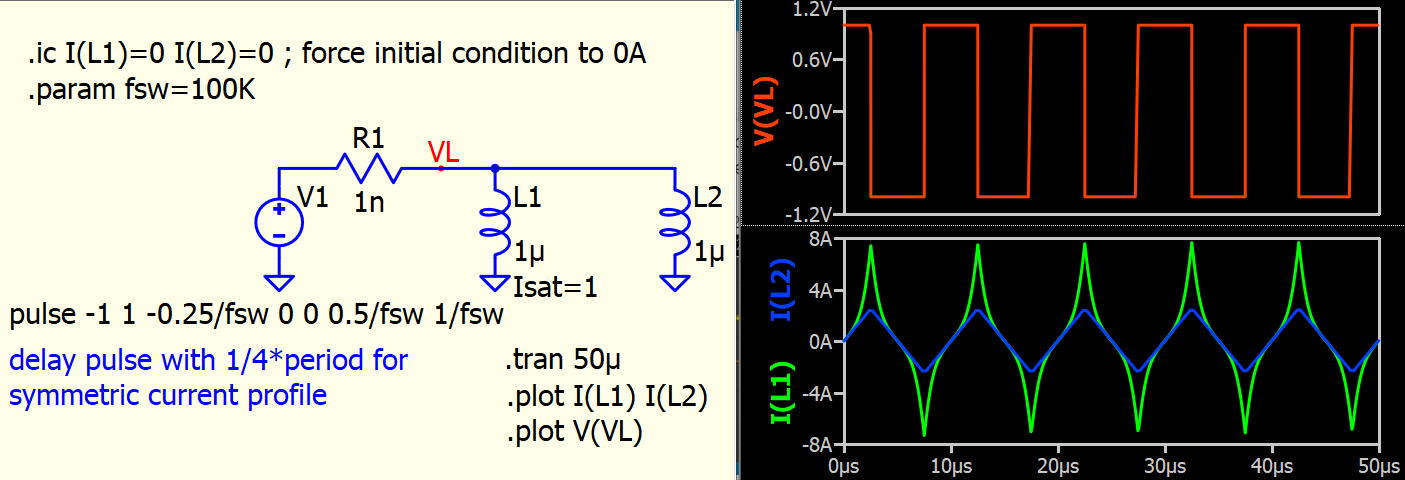
- Assign an initial condition for the current to prevent the .op calculation from producing a huge initial value
- To achieve a symmetric current profile with the midpoint at 0A, the square wave must be set with a delay of 1/4*period
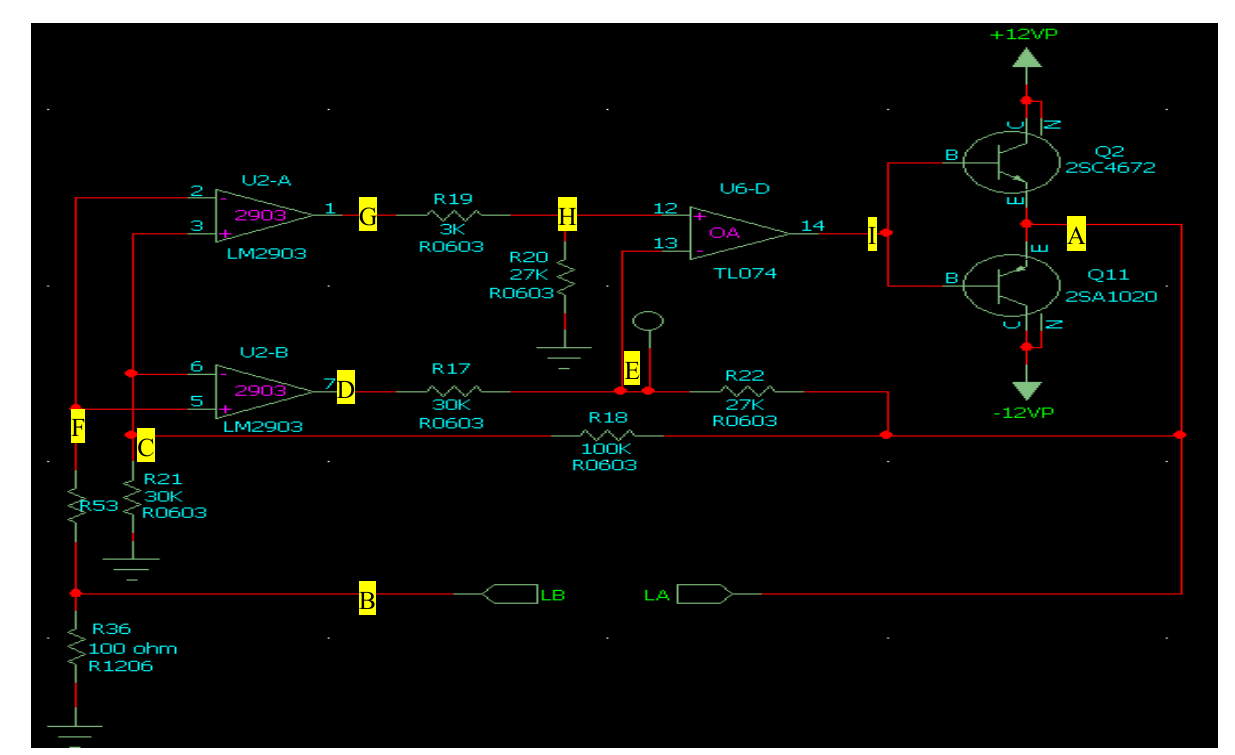
The oscillator circuit implemented with a saturable inductor is shown in the figure. A saturable inductor is connected between LA and LB. There is a slight difference between the simulation results obtained by me using QSPICE and the actual situation. May I ask what the reason is?
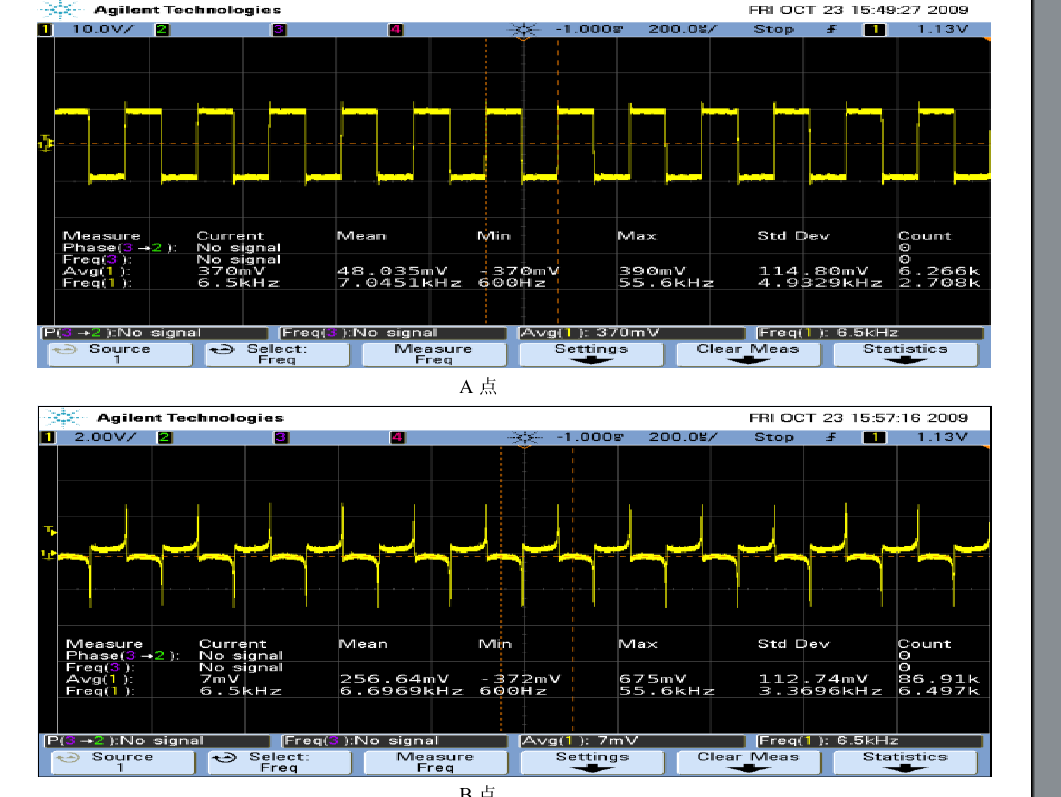
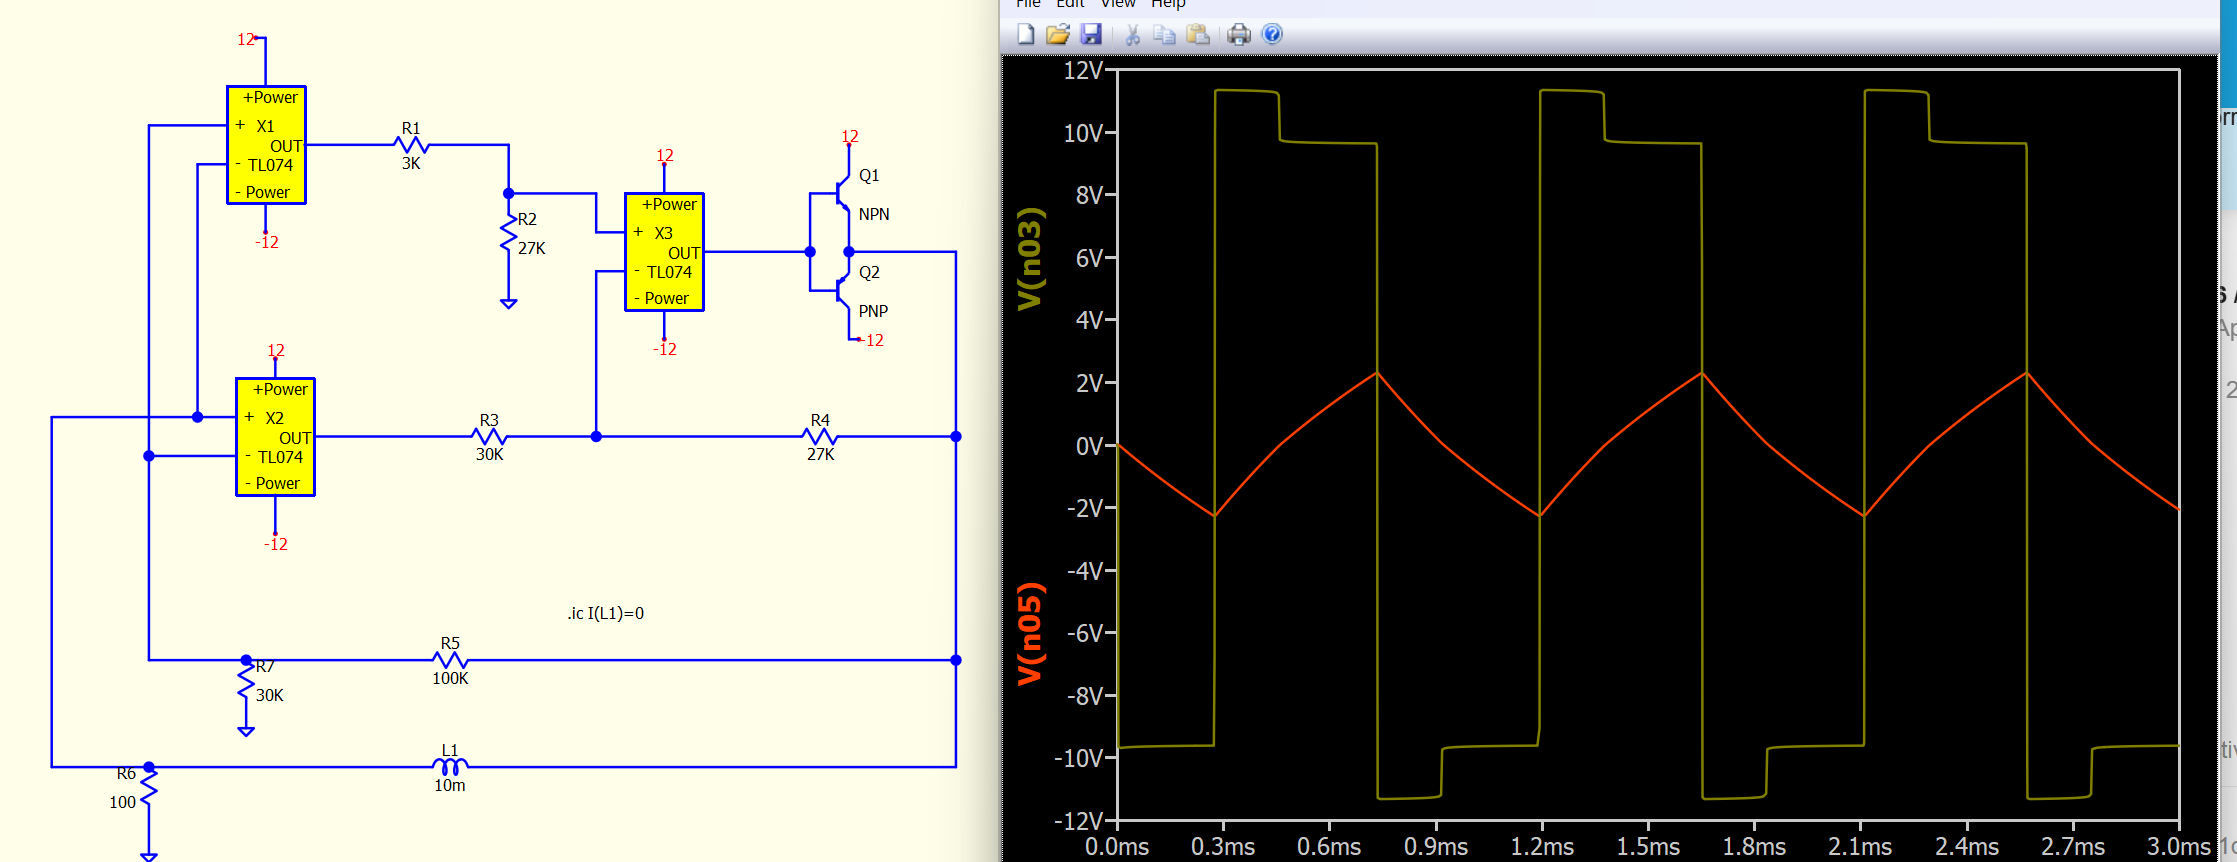
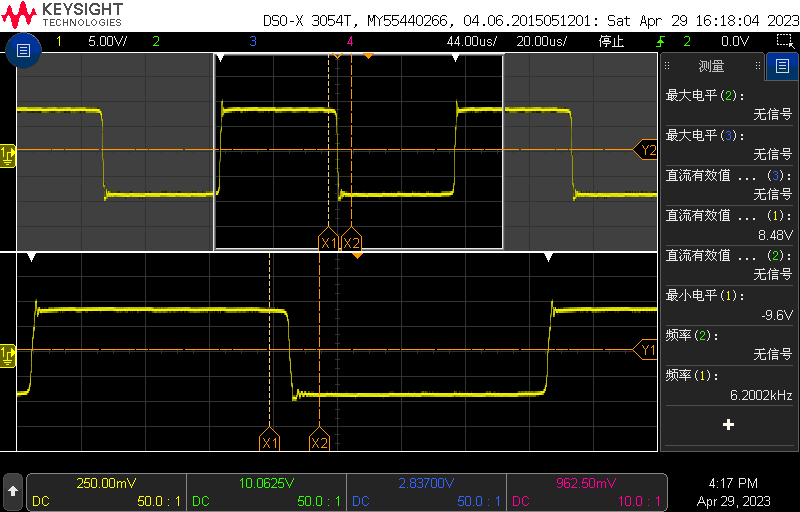
Your circuit appears to generate a square wave at LA (A), and between LA and LB, you suggest there is an inductor. LB (B) is connected to a 100-ohm resistor, where the voltage at LB is proportional to the current flowing through LA to LB. The question arises from your waveform: (A) is a square wave, and assuming the red part between (A) and (B) is in sync, meaning that during this duration, the voltage between (A) and (B) is positive.
For an inductor, V = L * di / dt. If V is positive, di / dt must be positive. However, what is strange is that V(B) (i.e. current) first decreases, then rises, and finally rapidly ramps up. The increasing and ramping can possibly be modeled by a saturation inductor, with the quick jump in switching possibly caused by the Rpar of the inductor. However, what cannot be explained is how to model the negative slope where inductor voltage is positive.
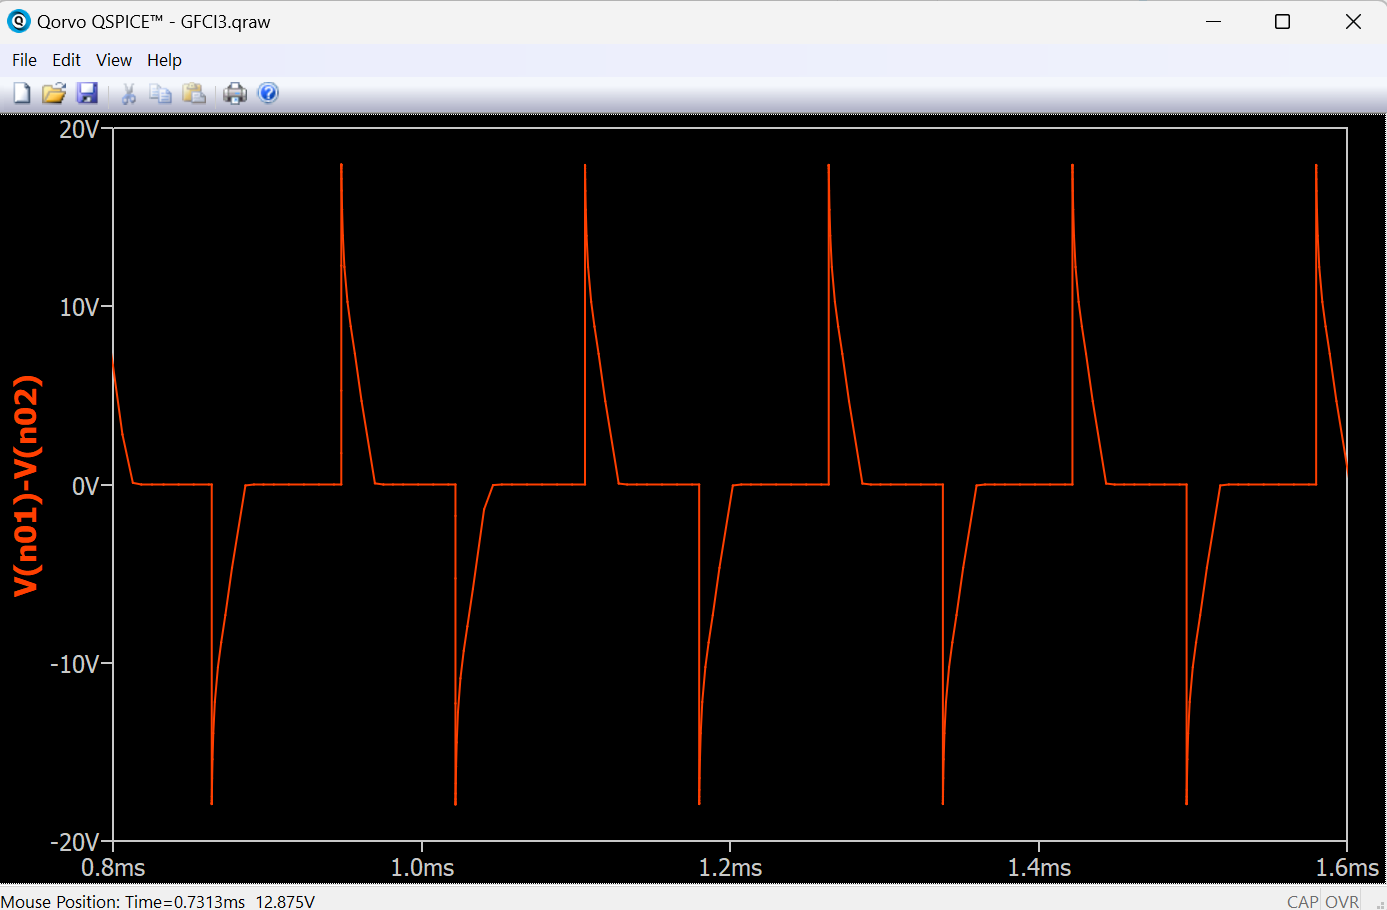
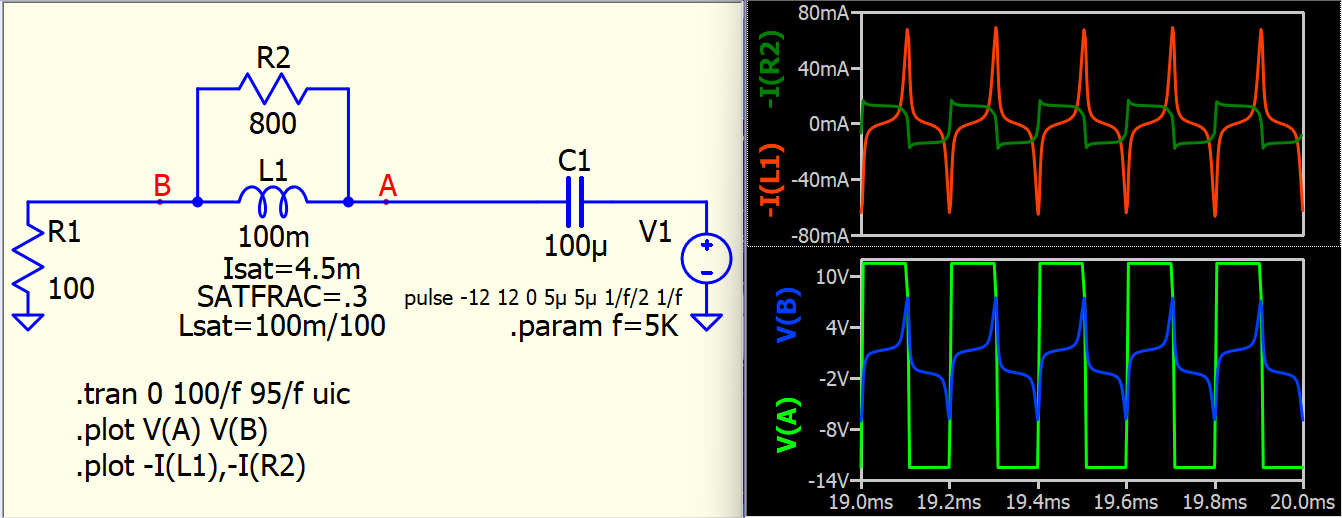
Here is an example of a saturation inductor model with Rpar (core loss). However, due to the limited details from your input and the question above, this is by far just a random guess and not exactly replicate the measured waveform.
SatL.qsch (3.7 KB)
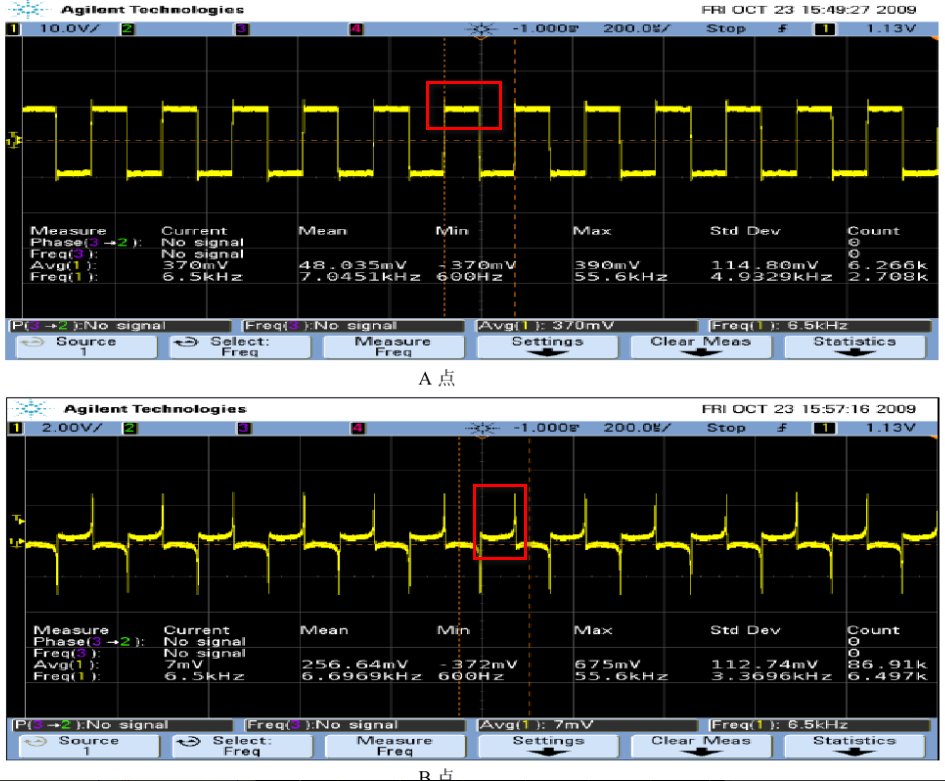
It seems that your simulation has achieved the effect I hoped for. You have carefully noticed details that I didn’t notice, the negative slope of the current, which seems to not appear in some theories I have seen, as shown in the figure. Maybe it’s the oscilloscope. Could you please explain in detail how to carry out the simulation of the saturated inductance, how this equivalent model is based on theoretical analysis, thank you very much。
Question needs to be more specific, I am not sure if I answer what you asked. If you measure your inductor inductance at different bias currents (there are different methods to do so), what remains is curve fitting with the inductor instance parameters Isat, Lsat, and Satfrac in Qspice. Alternatively, you can use flux model (a technique used before Qspice), but I anticipate that it is much easier in Qspice with Isat, Lsat, and Satfrac.
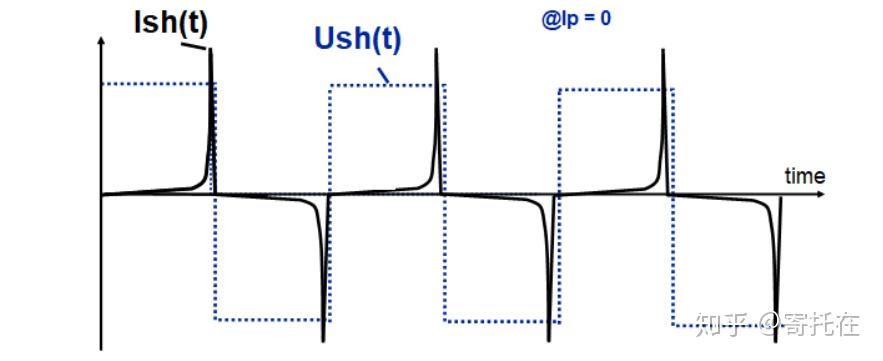
I am uncertain whether you are familiar with fluxgate current sensors; what I intend to undertake is the design and simulation validation of such sensors.The fundamental principles are as follows
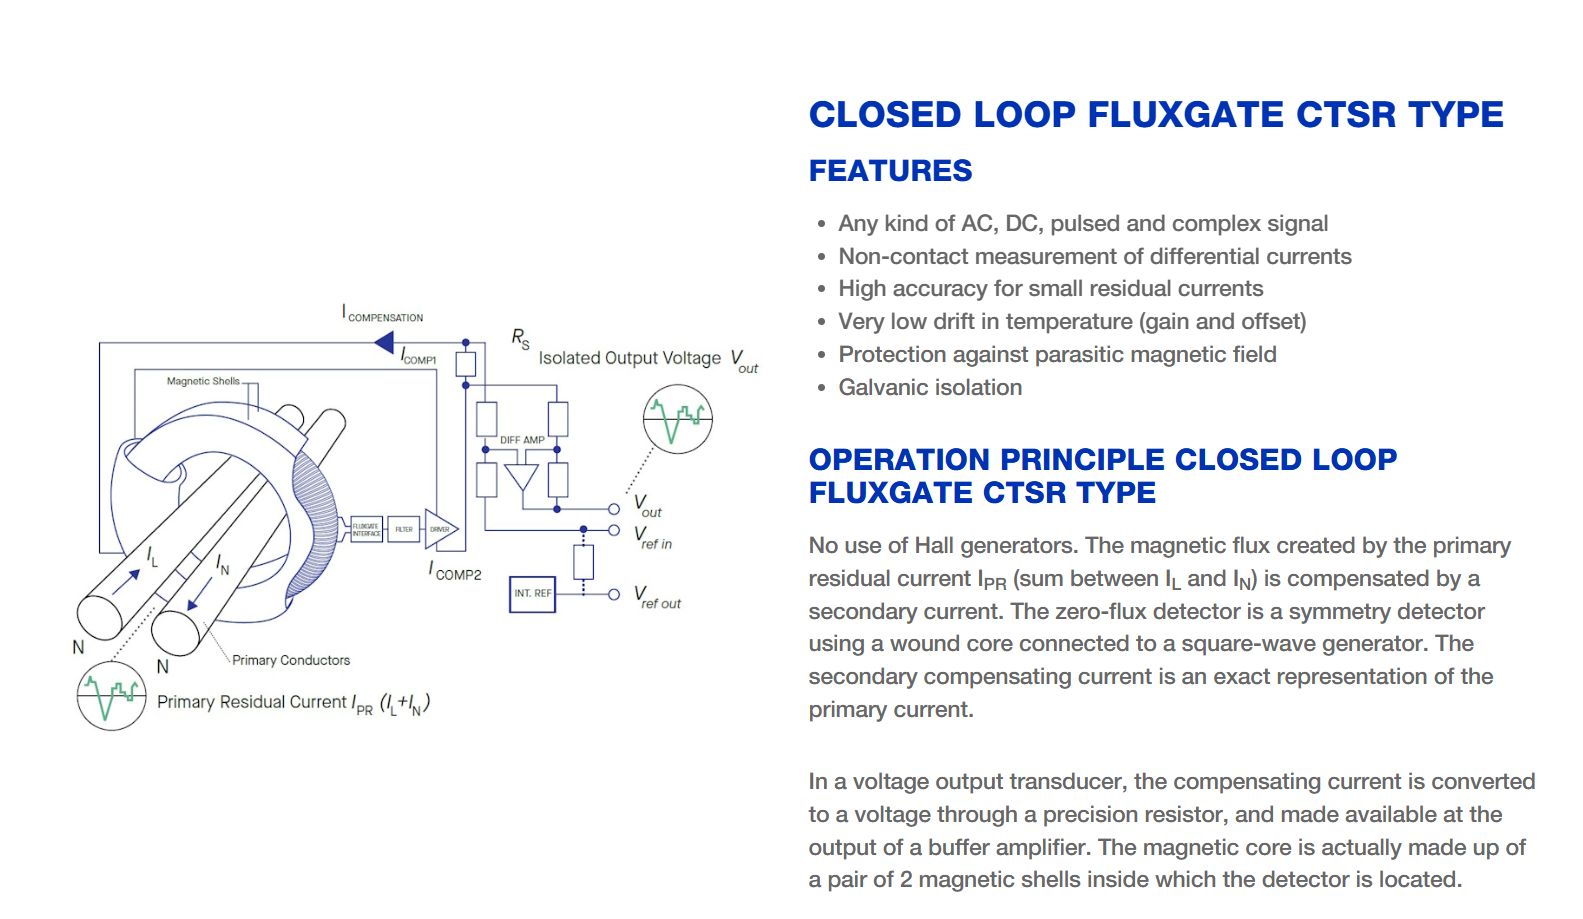
Its core aspect lies in the utilization of saturated inductance.
I am not familiar with fluxgate, but I know that Prof. Sam Ben-Yaakov has a three-part series on his YouTube channel discussing fluxgate with SPICE simulation. I believe it could be a good reference for you to start with (** I haven’t watched them yet).
An intuitive explanation of fluxgate current sensing Part I: What is a fluxgate? - YouTube
An intuitive explanation of fluxgate current sensing Part II: single ring, open loop - YouTube
An intuitive explanation of fluxgate current sensing Part III: Multiple rings, closed loop
Thank you for the materials you provided; I will take some time to study them.