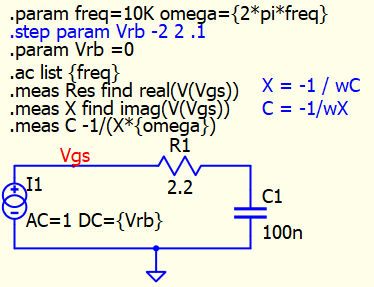
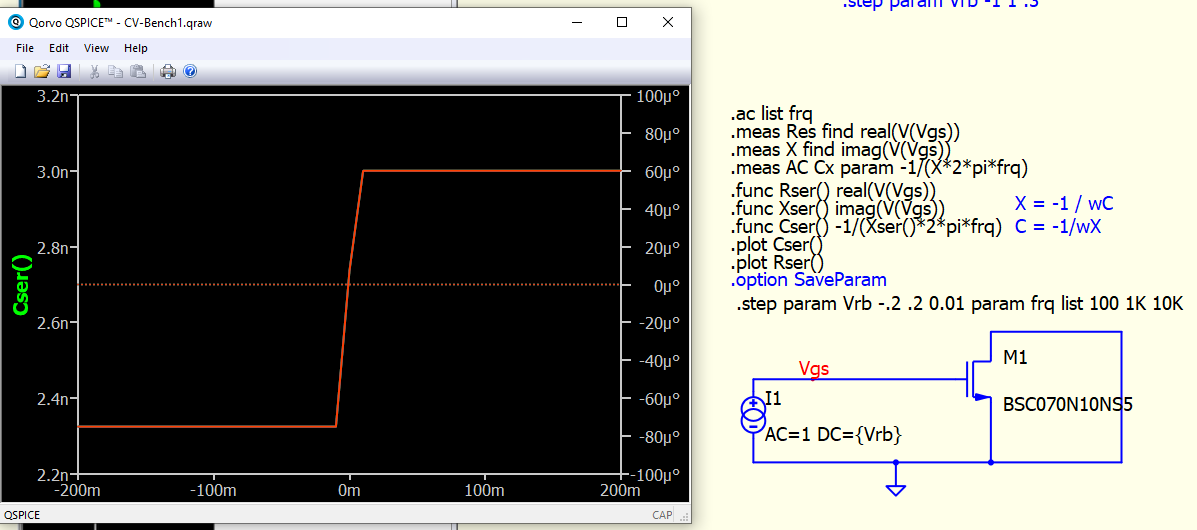
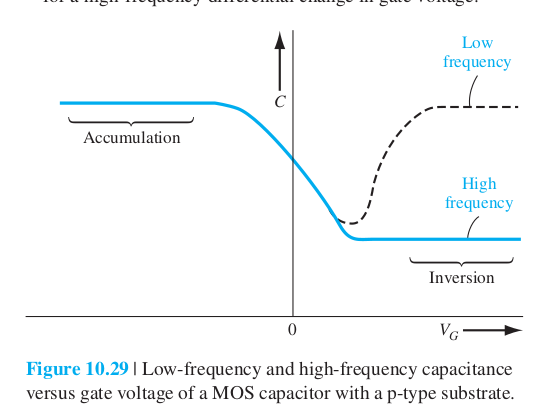
Maybe I could explain what I’m actually trying to do. I’m trying to examine spice models of FETs to see how well they line up with my semiconductor device textbook. One characteristic is the capacitance vs gate bias curve:
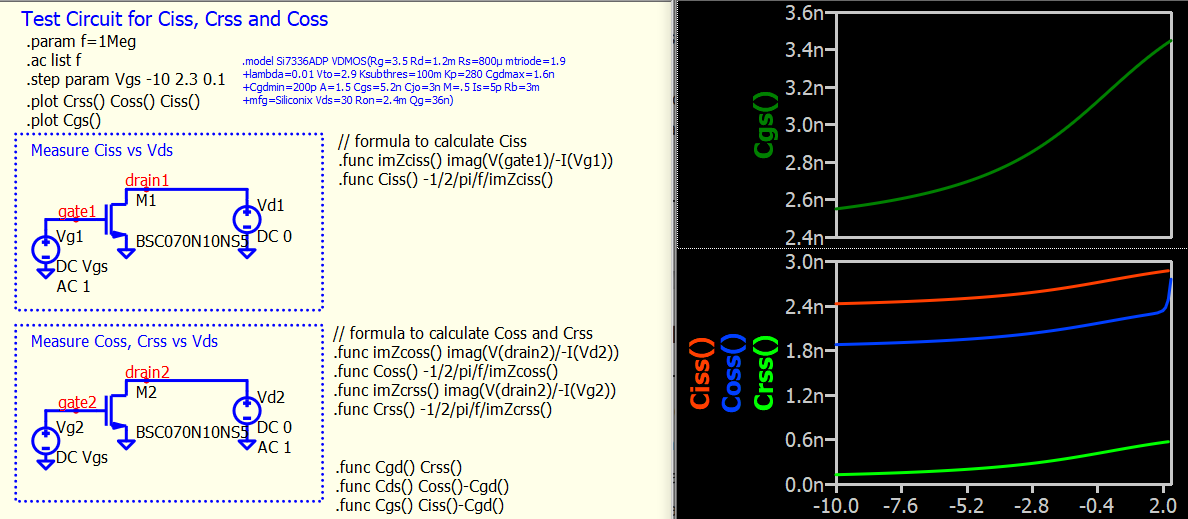
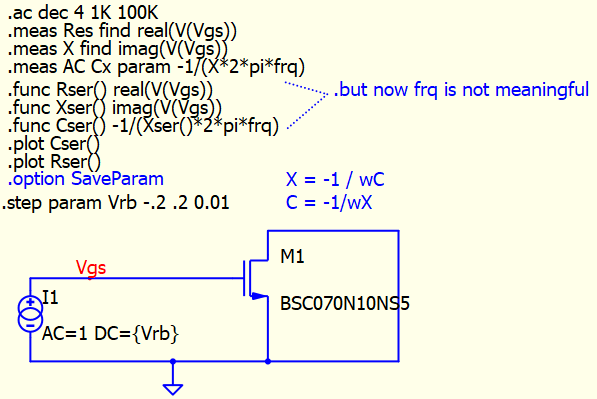
Testing the BSC070N10NS5 as as first example, using the .func statements to get the information, I do see a shift in capacitance, but not exactly like the textbook. One difference from theoretical is the lack of frequency dependence, and also the capacitance steps very abruptly and in the opposite direction with forward bias:
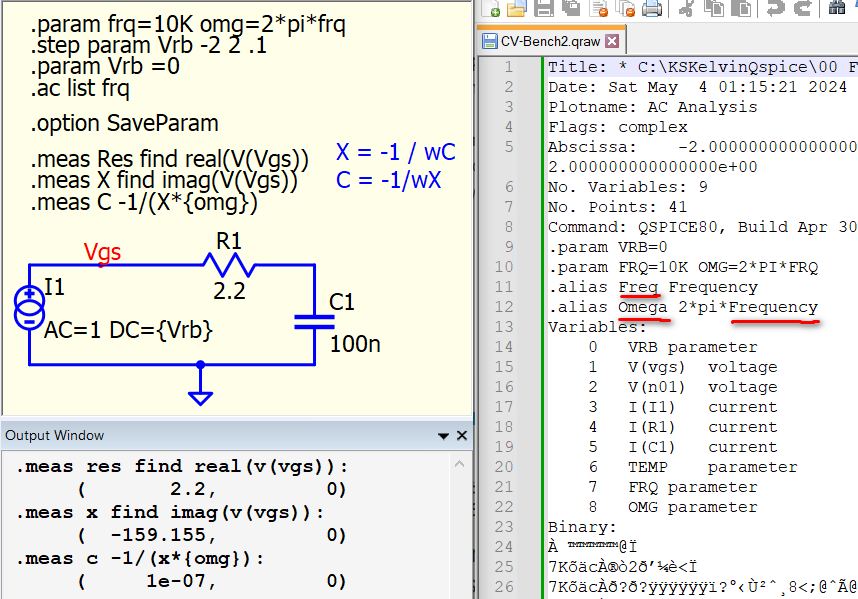
Regarding the discussion above: the .meas statements are subject to what you say
" .ac list is a single point simulation, and for single point simulation (e.g. .op, .ac list), their first step directive is not treated as stepped and .meas will only return one dataset."
Indeed, I only see a single value for each .meas at each frequency, while my intent was to have a .meas result for each bias at each frequency. You explain that
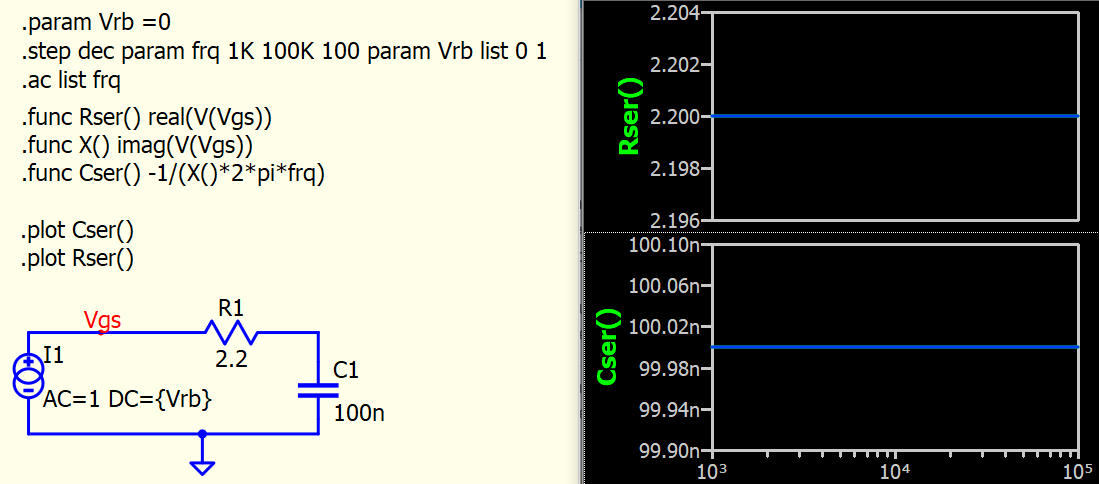
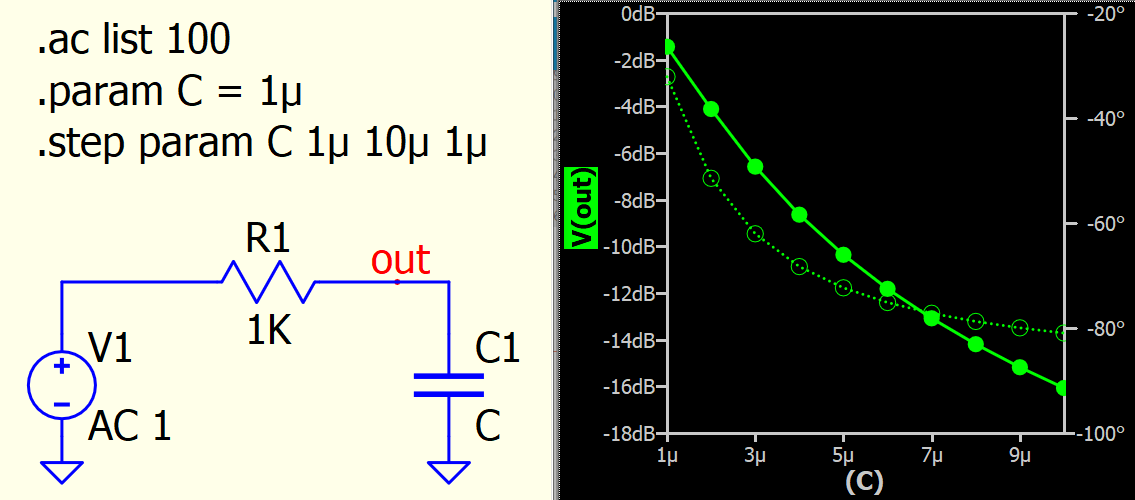
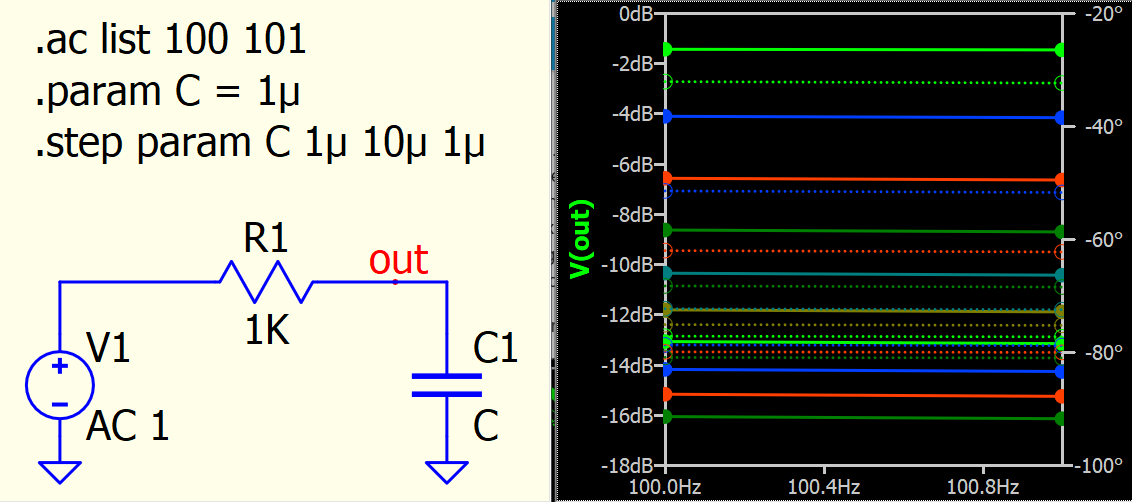
" if Qspice handle this single point analysis (.ac list) as stepped for first .step loop (i.e. step param C…), you will get multiple lines with x-axis at frequency 1kHz. But instead, you now get C as x-axis as you know this is tested at 1kHz. If single point analysis (.op and .ac list) treat first .step as stepped, the multiple line plot of each with a single point of data will not be visually useful."
But, again, the plot from the textbook is what I would reproduce, and that is visually useful: a family of curves of different frequencies. Does the explanation of my intent change your understanding at all?
I believe I understand now. While the param frq is indeed going through the list in the .step command, for each .ac simulation, it only sees .ac list frq, or a single frequency. And while this is what I intended, I’m not sure why the .meas evaluations don’t all get saved. See below for the effect of .option SaveParam. I guess the meas evaluations don’t all get saved because the scope of the meas is within a single ac sim?
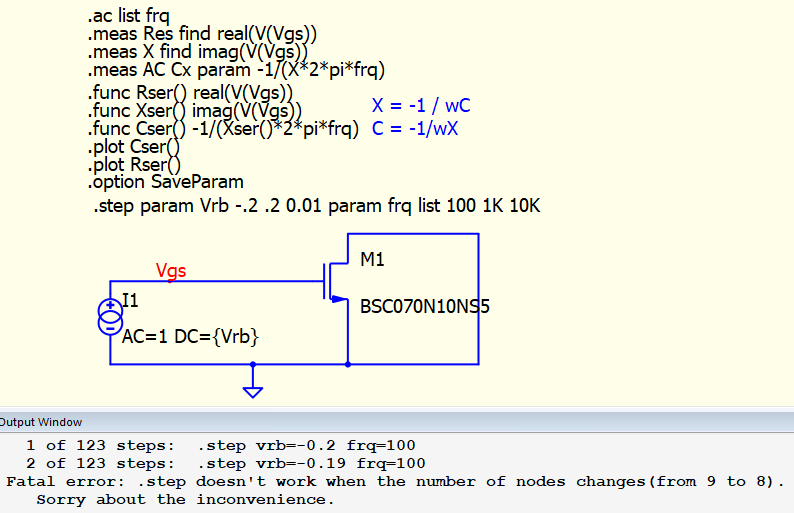
To further pursue my intent, and to test if there is something fundamentally different about .ac list compared to .ac dec, it would intuitive if the following worked:
Is there a way to get the frequency the simulator is using for a particular run? Then I could replace frq in the .meas and .func commands.
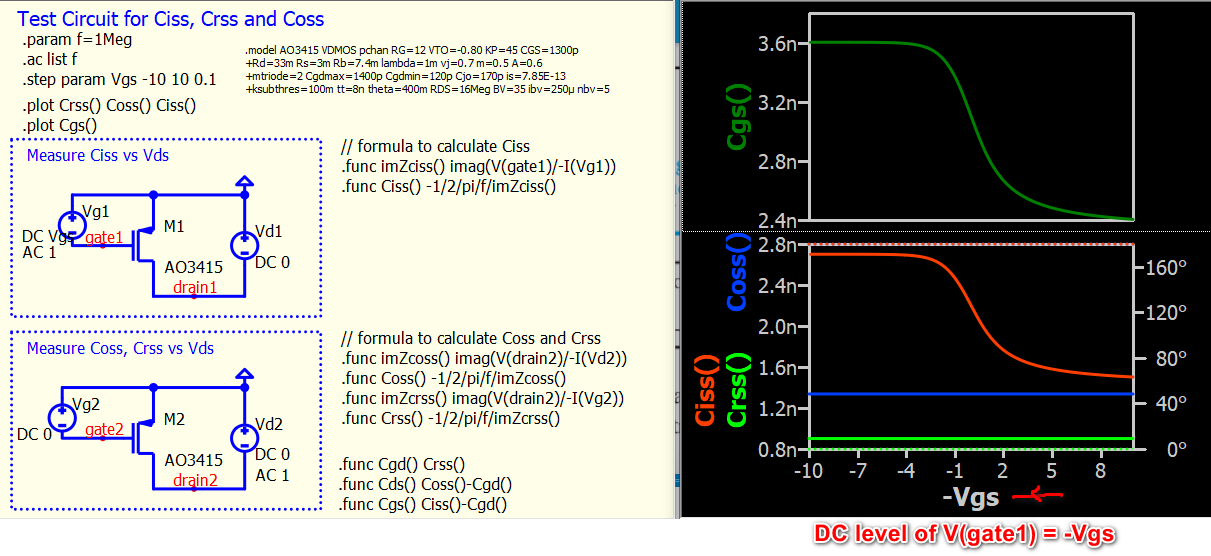
While using the results of the .func statements seem to be what I need, the results differ from the theoretical textbook curve. I can test other devices to see if another model more closely resembles theory.
As soon as I add the .option SaveParam (whether this is still relevant or not), I get this message: