I am simulating a circuit with a stepped parameter. I need to draw the rms of a current for each step within a window of time.
I am using the following statement, but apparently it is not wrong.
The help is not very clear to me on how to implement this.
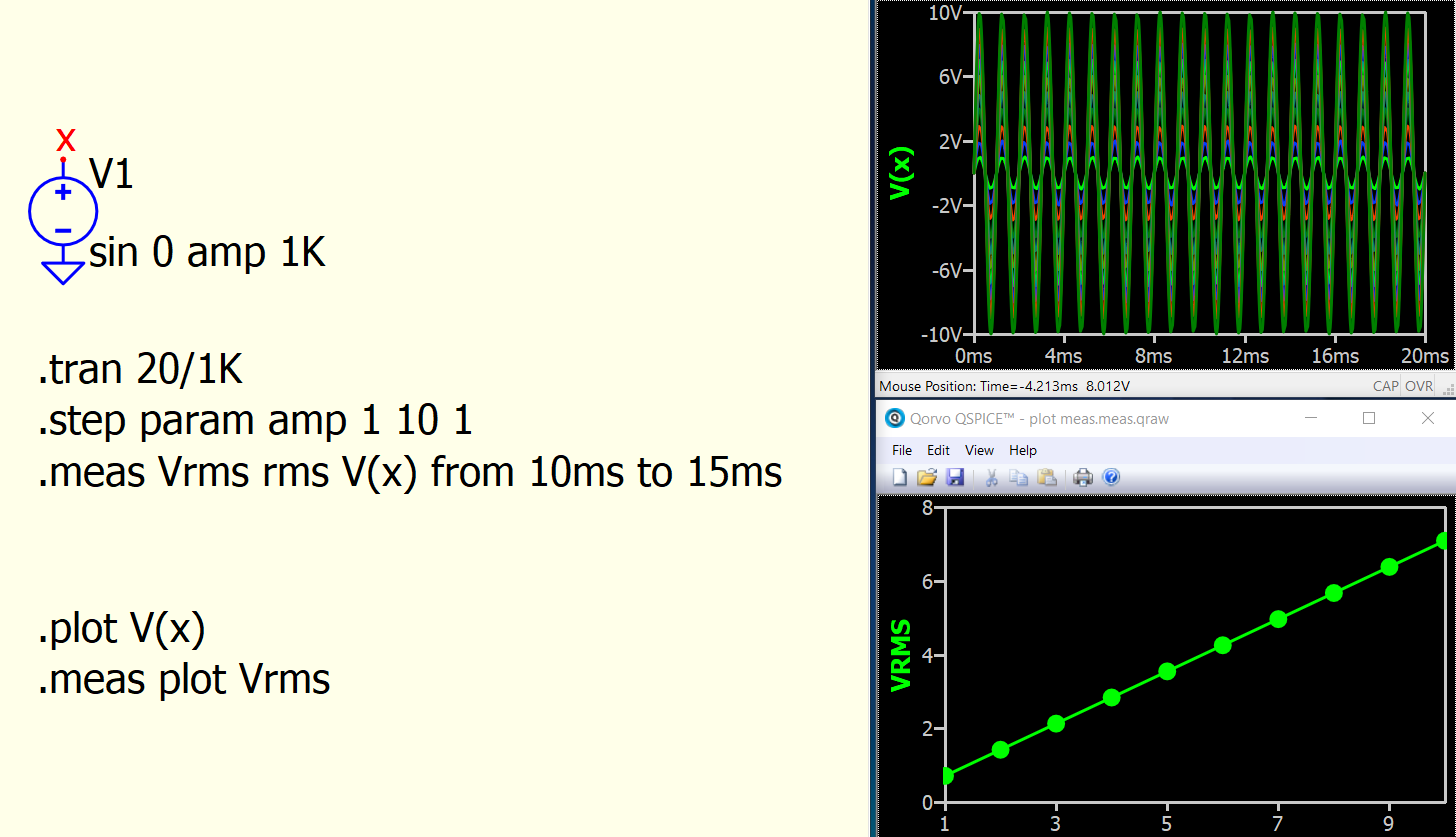
.meas plot IL1_RMS RMS I(L1) from=100m to=240m
This is how to use .meas plot
For next simulation, you must firstly close .meas.qraw waveform viewer window to re-enable Run button.
Thanks so much, this was helpful.
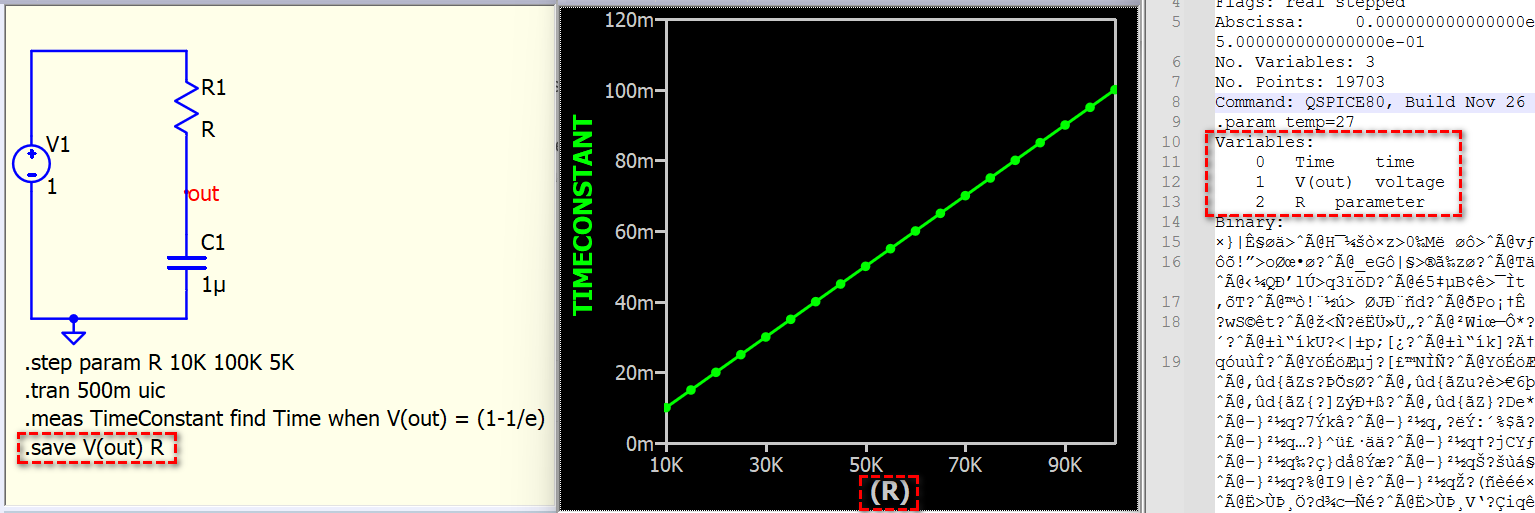
@KSKelvin - not sure if this is a “bug” - but it just took me some time to figure out that a .save statement prevents plotting measurements from .step:
Output Window right click → Plot These Measurements does not work with .save V(out) present.
It works without .save, but not with. Adding .meas plot TimeConstant does not help.
troubleshoot.qsch (2.3 KB)
This schematic contains a .step, and its .meas results are plotted against the parameter R. Using .save V(out) will omit R and result in missing information for .meas to plot. Therefore, you need to save both V(out) and R to generate the .meas plot.
1 Like