Today’s update includes the ability to see operating point data on the schematic. It operates vaguely like a hint, that is, hover over a wire of component and it shows the operation point data for that net or current.
If you find it distracting, and you might, disable it in Edit=>Preferences.
I like the new feature too, especially that I can make recalculate the op without running the whole simulation.
One thing what I missing a little is the display of positive direction (e.g. a little arrow) of the current. For example, I was suprised for a moment because two series resistor current direction was opposite (I just rotated the resitor back and forth during editing and accidentally put it forward). But there are real situations where this is important.
The op values are shown on status line, but it works only when I click on the element or node. I would be better if the op values are shown alwalys in status line regardless of the setting in preferences (“Enable operating point display” swiches off both the hovering and status line display).
I would have liked to ask for power display but I noticed I works with CTRL key. Really cool. Thank you.
Hi Mike, I really like this feature, however I have come across some situation were it also would be very nice/helpfull to be able to place some fixed display of the operating points at some nodes.
For documentation when snipping the screen and for when you have two or more similar circuits and want to quickly se the differences in certain nodes.
This is very good. However, is there a way that all .operating points are just displayed in the output window?
This would be really helpful rather than hovering over each and every node…please suggest
If you run .op, you can directly goto step 3. If you run .ac or .tran, you need step 1 and 2
Add .option keepopinfo (or in Edit > Preference > Select Enable Operation Point Display), this allow to save operation point data into a file [filename.op.qraw]
Find the file “filename.op.qraw”, double click to open it with waveform windows
Thank you!
COuld you pls send me the command line prompt to output a file which has dcop info? (i.e. input is .op.qraw and output would be say dcop.txt)
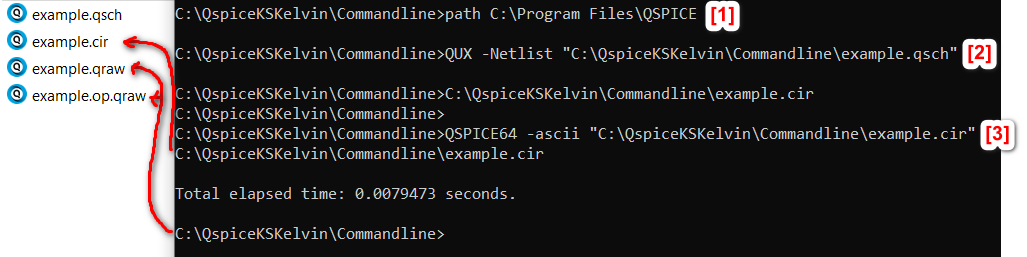
I only use windows, and this is command line example, by assuming your example.qsch consists a .option keepopinfo
But there is one problem, ascii output format can only work with [filename].qraw, but [filename].op.qraw is still with binary data.
I cannot find a way how can use QUX.exe -Export to generate a file equivalent to [filename].op.txt. @Engelhardt Is there a way to use command to export operating point .txt format as in GUI interface as shown above?