Log (V2.0) is an update to my previous component Log. New Component: Log
It has additional control features such as:
Selecting the number of inputs to log.
Selecting the trigger type to use (Rising Edge, Falling Edge, Window High, or Window Low) to capture the data.
file format data type to use (.CSV or .TXT or .BIN).
Selecting the data precision to store.
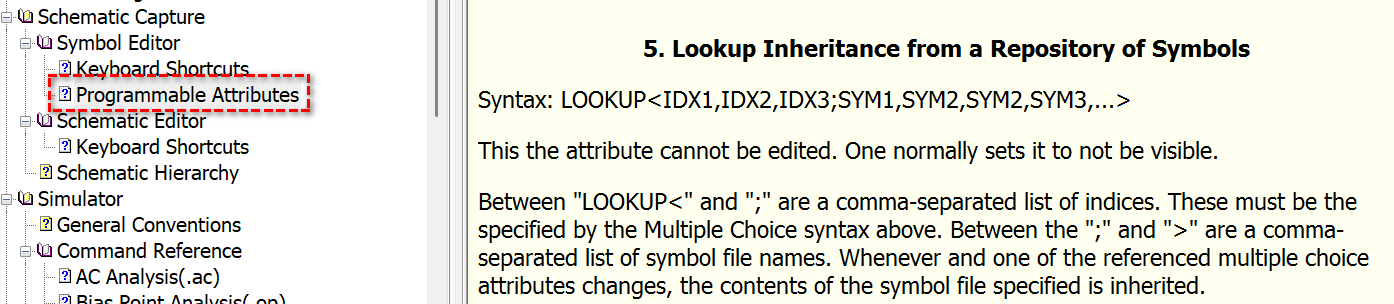
It also uses a little known feature of symbol generation using LOOKUP<> to build the desired symbol “on-the-fly”.
Quick Synopsis: This Log component allows the user to store only specified data to a logfile only on specified trigger conditions. This data can be used for later analysis using QSpice or other external tools such as Excel. I have personally found this very useful for the extremely long and data intense sims I tend to run.
The installation instructions are included in the “log(V2.0).pdf” file.
Here is an animation showing how to the number of inputs to use:
Here is an animation on how to change the Trigger Type:
This component might intrigue you to create your own symbols using the LOOKUP<> feature.
This is not for the “faint of heart”. The LOOKUP<> feature, in essence, allows the layering of multiple symbols. It does get tricky when attempting this using C-Block (or Verilog) components. This is because the order of inputs, input parameters and outputs are very important.
If you’re interested in how to use the LOOKUP<> feature, study how this component implements it. If further discussion is needed, we should probably start a new topic specific to the LOOKUP<> feature on the QSpice forum.
@lpoma So, currently, does LOOKUP support storing subset symbols in the local path? Is there no longer a requirement for them to be stored in (QSPICE installation directory)/Repository/SYMBOLNAME/?
[Oh, looking at your PDF setup guide, it seems that it still relies on creating a directory within the QSpice directory…]
This is a very interesting example to demonstrate the use of LOOKUP.
For the logger, just a simple question: why not use .save and .option culltime=<value> to decide which signals to save and the minimum time interval between two data points? I am wondering what the difference is between using a logger and those directives.
Yes. Apparently, the (QSPICE installation directory)/Repository/SYMBOLNAME/ still needed to be the location of the second-level of symbols.
I’m hoping that Mike might consider that the location where the top-level symbol is stored could be used to find the second-level symbols. Then, when a symbol is pulled from the Symbol & IP Browser, it can look for the second-level symbols in that path BEFORE looking in the Repository. That should prevent the need of copying the LOOKUP symbols to the Repository.
I knew about the .save directive. I could list only the signals needed to save. However, I didn’t know about the .option culltime= directive.
Your suggestion might work in certain instances where you are trying to save data with the trigger being constant intervals (ie. the culltime). Thank you for bringing it to my attention.
However, the sim I’ve created this component for was a special requirement. The goal is to capture only one log line of data per step. The trigger of the logging is the detected “connect” of two asynchronous systems. Once the connect occurs, it logs the data (along with the time it occurred) and the sim step is stopped. The next step is started and the process repeats. I generally repeat this process 1 million times!
In the above example, the connect occurs when it occurs, therefore, culltime won’t work.
Additionally, the trigger type can be a Window High or Window Low signal to log data on either condition as a windowed capture.
Yes… because second-level symbols are required to be stored in the Qspice installation directory, I just ignored this feature in Qspice, as I think very few people will go through so many operations, and every update will clear it up. In general, people download one zip file, extract it, and expect to add that folder and be good to go.
When I was reading this, it seems I had asked this same question in Version 1 and you had already explained it to me before, as this answer looks familiar. Sorry if I asked this same question again.
GitHub is great; it allows us to download the latest version. The forum keeps files permanently.
Looking forward to seeing you share more projects and libraries there.
I experimented with the .options culltime directive. In effect, I was trying to disable .qraw output and use my log component to gather the data instead.
I ran the same sim with 1Meg iterations. It takes a long time to complete. I ran the sim:
in batch mode using Qspice64.exe with .qraw disabled (my usual method)
in Schematic mode using QUX.exe with .options culltime=simtime+1 (culltime > simulation time to try to disable .qraw data loading)
in Netlist execution mode using QUX.exe with .options culltime=simtime+1 (culltime > simulation time to try to disable .qraw data loading)
Here are my timed results to complete 1Meg iterations
Batch = 1.1 hours
Schematic = 46.56 hours
Netlist = 47.07 hours
It can be seen that the Batch method is at least 42 times faster to get results.
More observations: Although the culltime was set to the max simtime + 1, it still generated a .qraw file with one point of data at 0.0 seconds. The file size at the end of the run was 187.5MB.
Also, both the Schematic and Netlist methods were reasonably quick to execute steps in the beginning, they were significantly slower as they progressed. I’m assuming this is because at the beginning of the next step, they had to:
open the .qraw,
find the end of the file,
log the 0.0 second data,
close the file at the end of the step
repeat the above steps.
I think in Schematic and Netlist mode, QUX is also performing other background tasks such as looking for the “abort” from the user and/or other GUI-related tasks.
In general, .option won’t update during a simulation. I guess in each step, the culltime is likely fixed and the entire simulation run based on the input from the preprocessing phase (i.e. before the first step begin). Since you are stepping your simulation million times, I think the best way is probably your logger approach, while disable the .qraw file.
I think culltime generally benefits .tran analysis, but stepping a million times is not a common workflow for most people in simulation. Therefore, I think you are on the right track by implementing a workaround to help.
I didn’t know you ran huge number of iteration, that why I mentioned culltime as I just assume you was working on transient analysis.
If you need to run your simulation in the GUI, I think you can check with Mike to see if it is possible to add an option to disable saving the .qraw file and suspend the waveform viewer from the GUI. Normally, I don’t think anyone running a simulation considers not saving the .qraw file, but you have a special situation where you save data through a DLL and have to disable the .qraw file to prevent it and the waveform viewer from slowing you down. But possibly you need to explain clearly your situation as this request sound unreasonable without knowing what you simulation setup is.
The reason I’m running 1Meg steps is to achieve 1 ppm resolution on the statistical latency of a BLE connection.
Both the BLE Advertiser and the BLE Scanner are asynchronous to one another. Therefore the start of the Scanner interval and the Advertiser interval have a random time difference. Add to it that the BLE Advertiser, as an example, set to a 300ms interval is actually an interval of 300ms plus an added random value of +0ms to +10ms. Hence the reason it is a statistical latency.
The 1Meg steps allows for many random Advertiser and Scanner starting events to each interval.
Once a “Connection” is detected by the Scanner, my log component captures, on the rising edge of the “Connection” signal, the time and which Scan channel detected it.
The goal is to find the “sweet spot” of the Scan duration and interval and the Advertiser interval to provide the lowest statistical connection latency while optimizing both the Scanner and Advertiser to lowest “ON” time to preserve power required.
I’m making some last changes to my BLE Advertiser and Scanner components to share with the forum. Hopefully, I can have it done in a week or two.