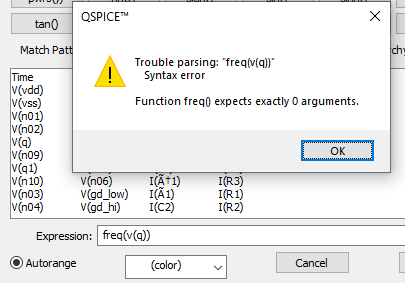
I’m creating a voltage controlled oscillator, which produces a square wave output. I’m setting up a .step sweep to plot voltage vs. frequency. However, I can’t figure out a way to have Qspice plot the frequency? I see there is a “Freq” function for the waveform view, but it’s not clear to me how that works.
I attempted to write the following expression in the waveform viewer: freq(v(q)); v(q) is my square wave, but this resulted in a syntax error.
this is for a .trans analysis. @KSKelvin
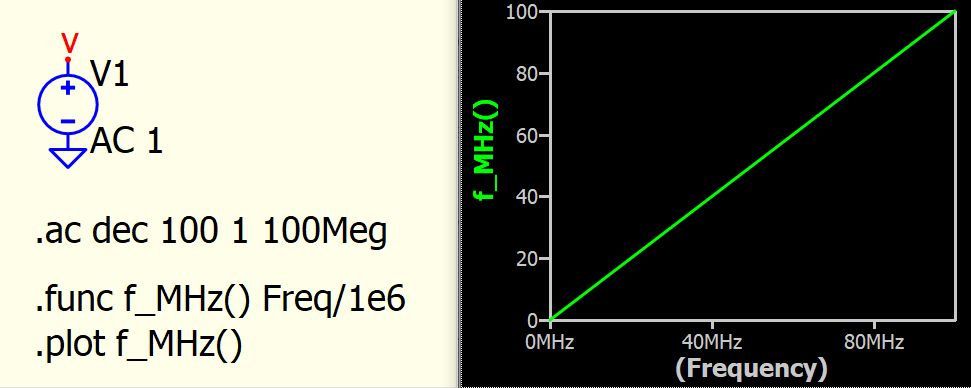
I found the below example in your reference guide. This is exactly what I’m trying to do.
But I can’t figure out how to output the results of the .meas statement.
You can take a look of my Command Guide, .meas section of how to setup .meas for this type of measurement. Or do you able to upload your .qsch to forum?
Your setup is correct, but you have to plot the .meas result. Qspice run your netlist with QSPICE64.exe or QSPICE80.exe, therefore, your first waveform window is to plot result from that, which is the file .qraw. .meas is a post-processing using QPOST.exe for .qraw datafile, its result return in Post Process window, or if you include .meas plot, it will create a file named as .meas.qraw for .meas result.
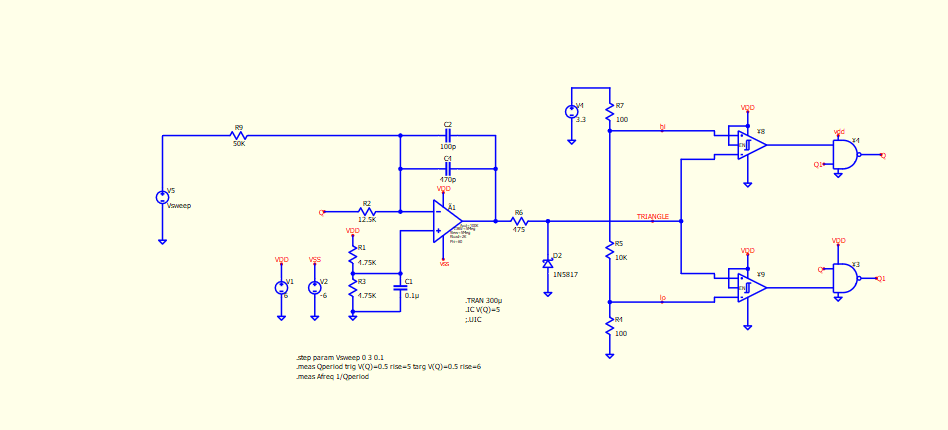
I modify your schematic by including .meas plot statement, and add TTOL to logic to improve timing precision.
To plot .meas result, you can also refer to my Command Guide, .meas section, page title “Plot .meas data in Waveform Viewer”. There are two method to do that.
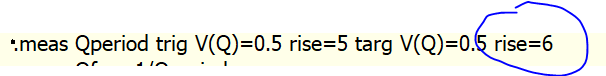
To measure the period, the waveform needs to repeat itself. In this particular case, the .meas statement is used to measure the time between the 5th rising edge through V(Q)=0.5 and the 6th rising edge through V(Q)=0.5. Therefore, this measurement is actually determining the frequency.