Hi,
test22.qsch (10.2 KB)
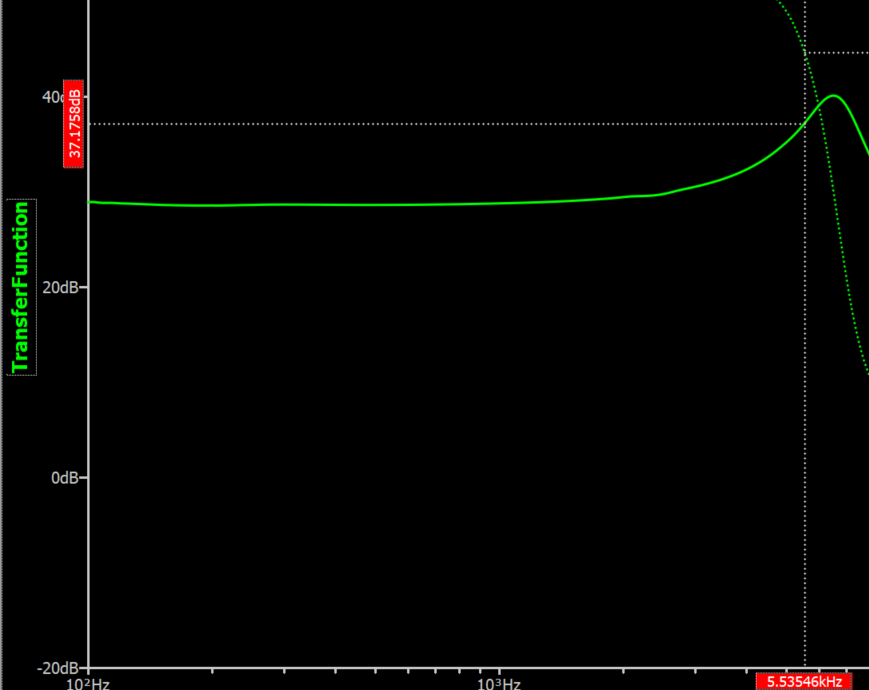
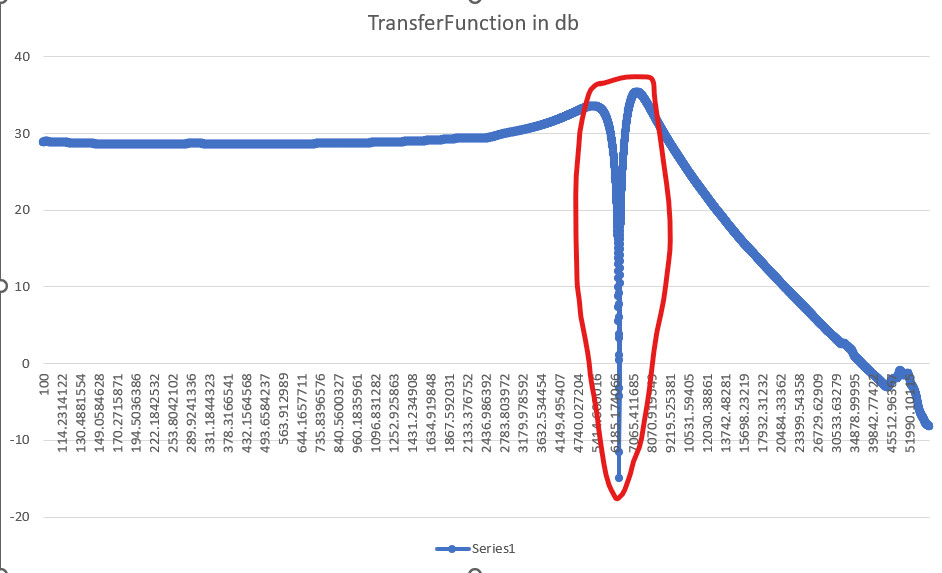
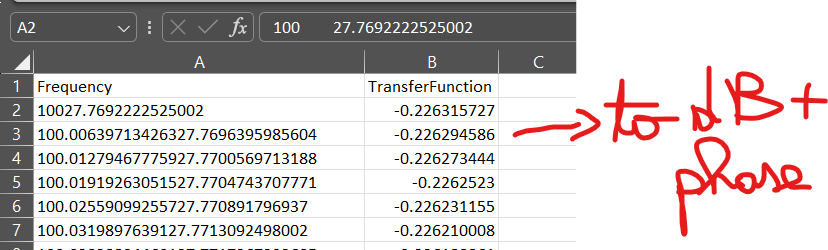
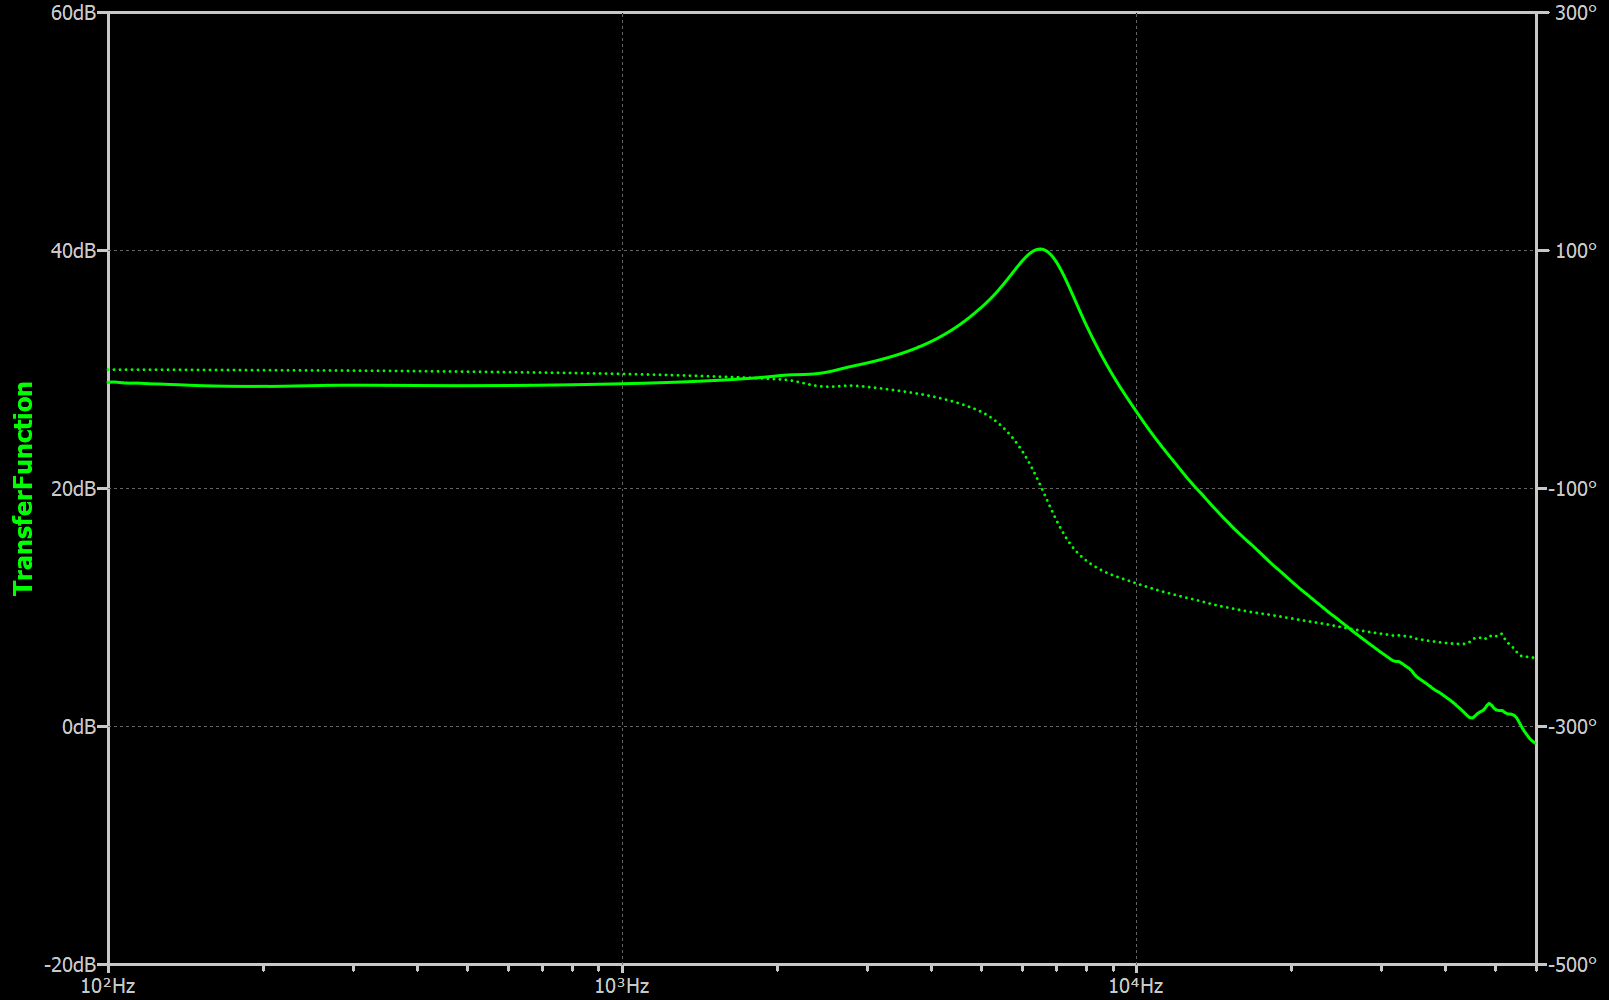
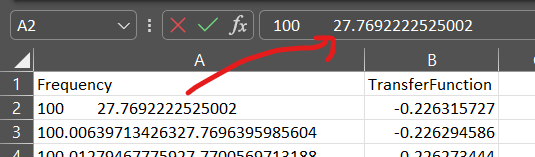
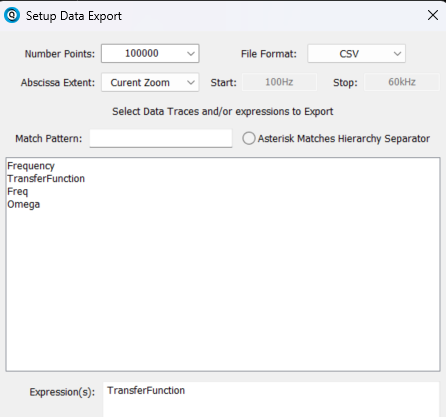
I want to export this plots in a csv file:
What is this?
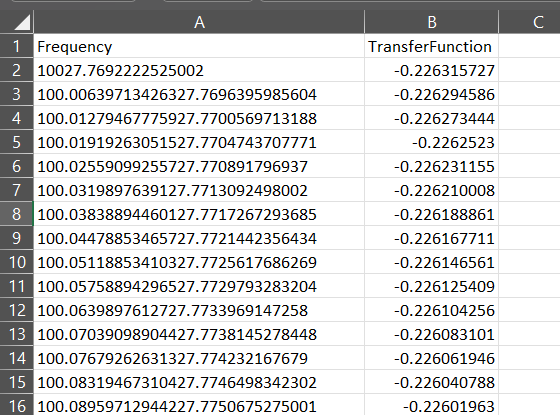
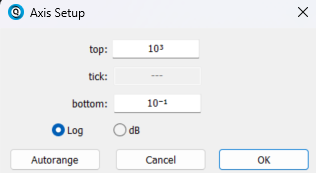
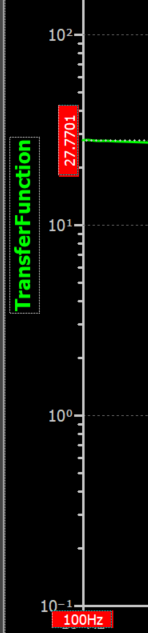
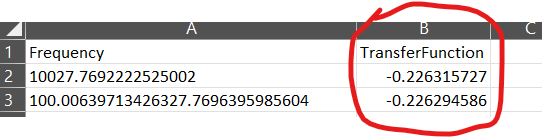
And if I separate first column:
Hi,
test22.qsch (10.2 KB)
I want to export this plots in a csv file:
What is this?
And if I separate first column:
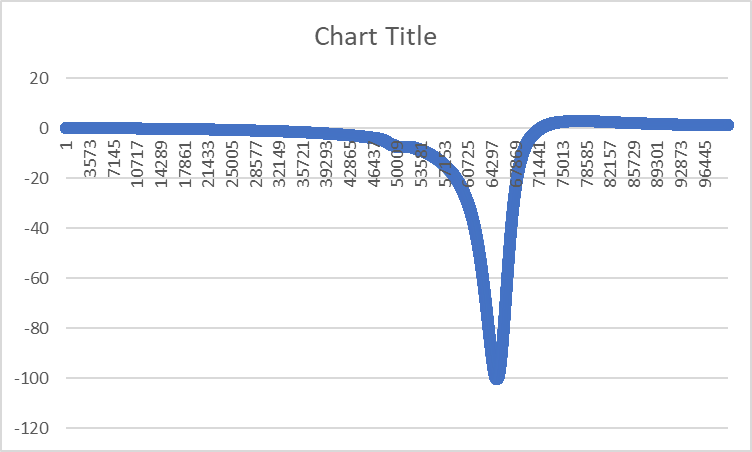
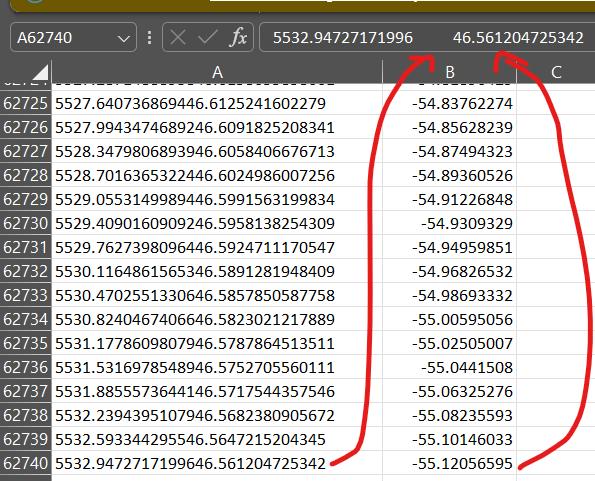
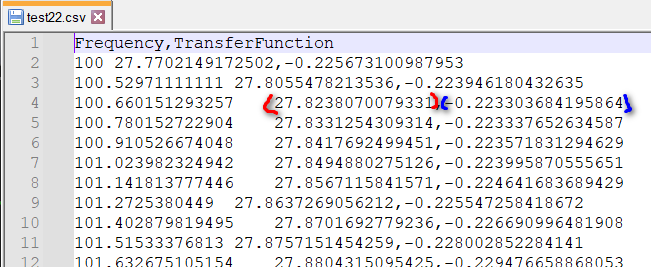
I could not upload the csv file, not even as txt file as exceed the maximum size file, but you can run the simulation and export data, thus obtained csv file, like below:
Where is the problem?
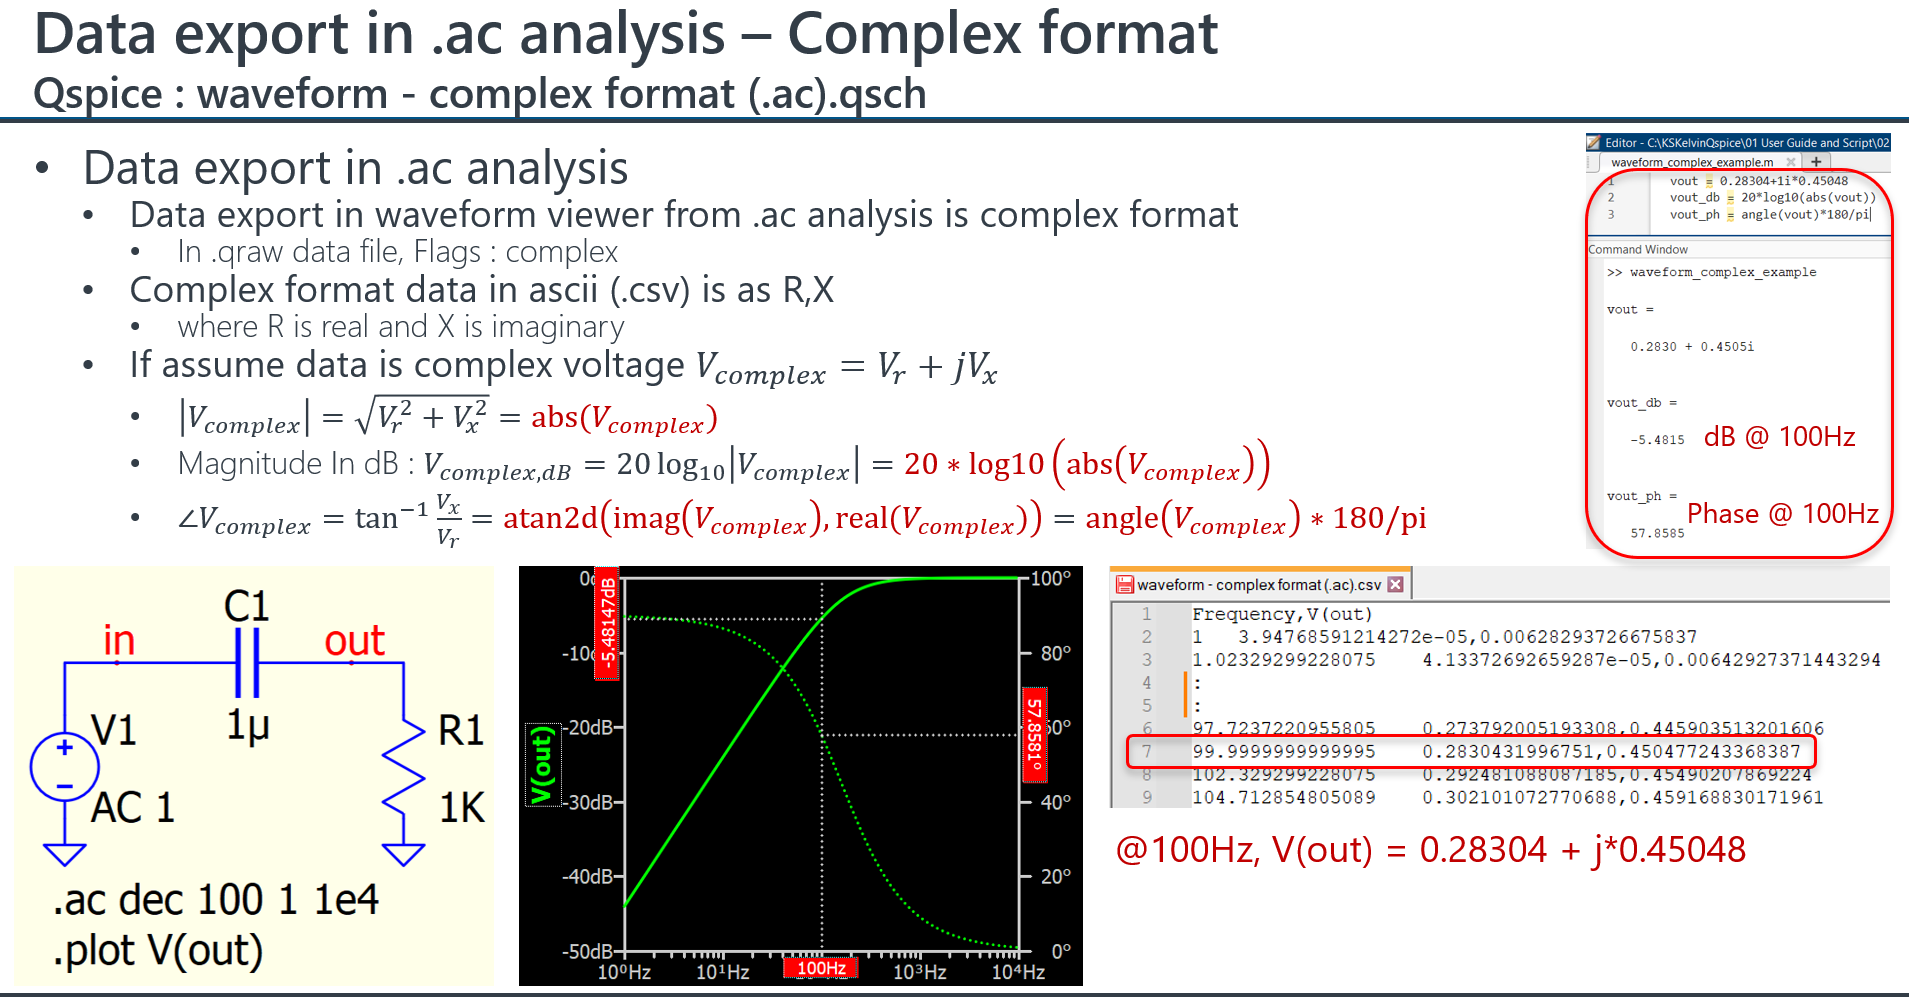
In Qspice waveform viewer, export .ac or .bode will give you complex data format
Complex data format in Qspice is (real,imag), in regardness of what you select in your axis, it always return (real,imag) in export data.
By the way, standard excel opening cannot handle this type of .csv, as frequency and transfer function data with space as delimiter, but each complex data in format that real,imag, with comma as delimiter.
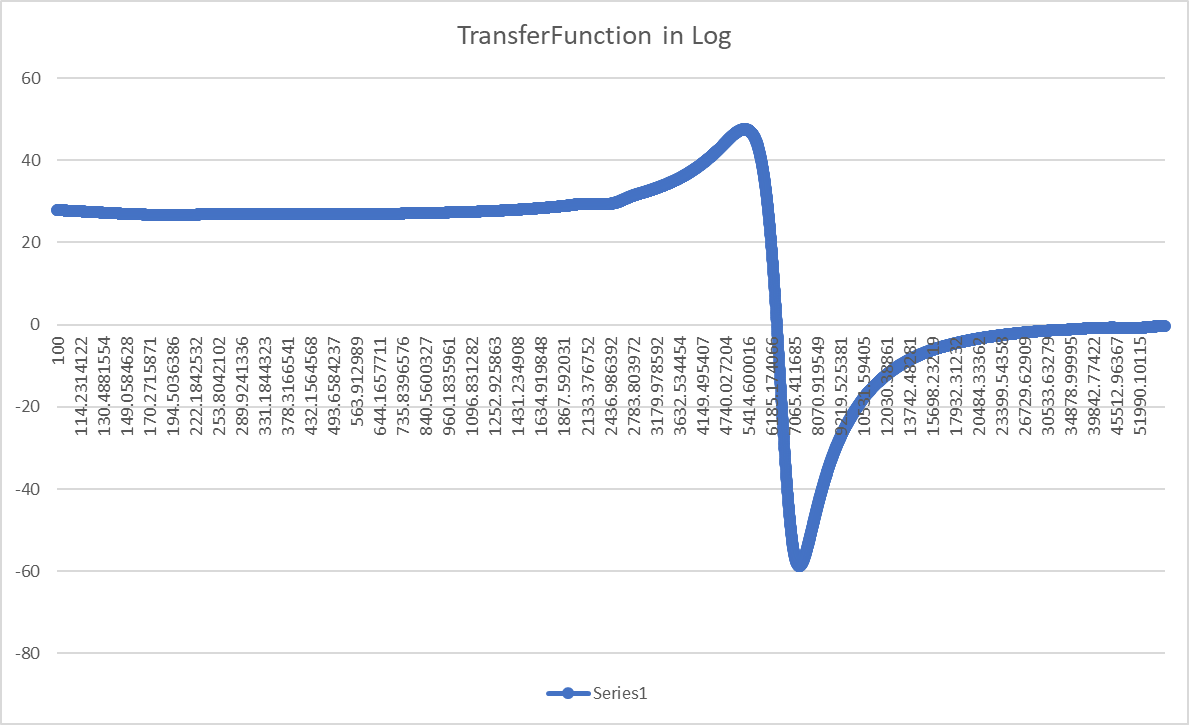
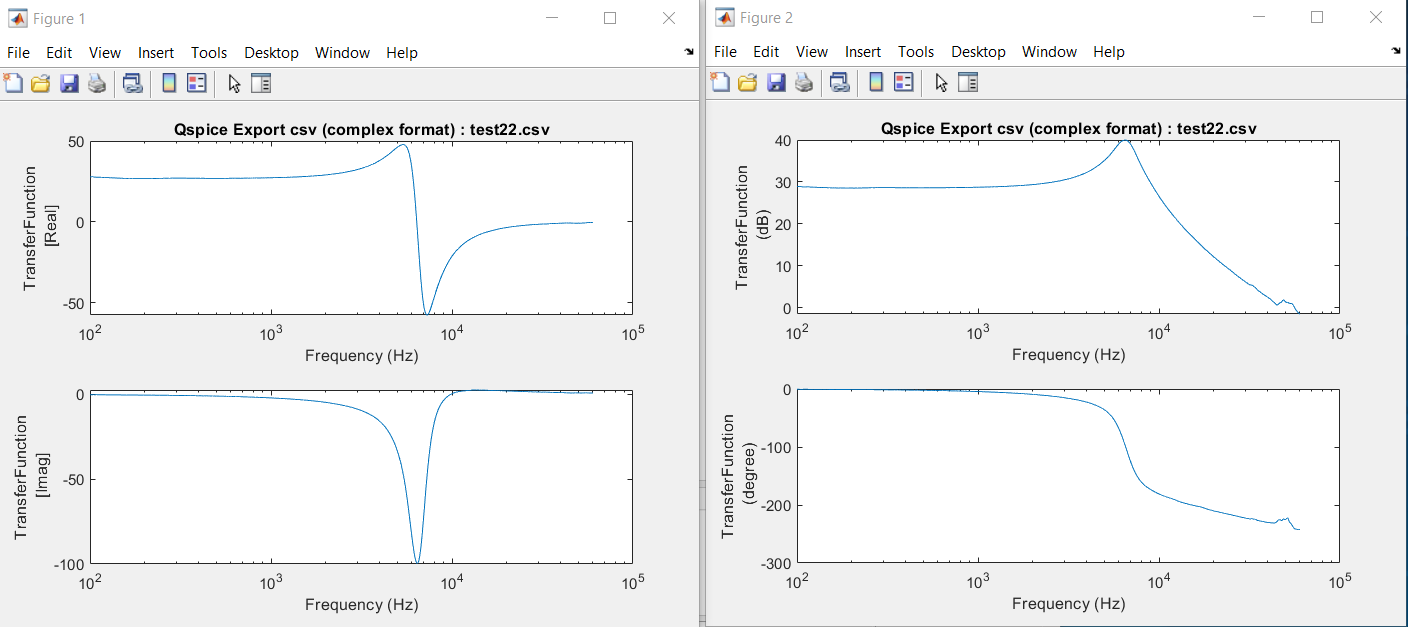
I write matlab to handle this type of complicated mixed data format and convert it back to dB and phase.
This is the matlab code which can plot complex format data back into dB + phase
The real and imag is what directly match to (real,imag) complex formatted data.
matlab code to load and plot Qspice complex format .csv export data
clc;
close all;
clear all;

[csvfile csvpath] = uigetfile('*.csv');
fid = fopen([csvpath csvfile]);
C = textscan(fid, '%s', 1, 'delimiter', '');
csv.headers = textscan(char(C{1}),'%s','delimiter',',');
csv.headers = csv.headers{1};
str = '%f';
for n = 2: length(csv.headers)
    str = [str,'%f,%f'];
end
csv.rawdata = textscan(fid,str);
fclose(fid);
for n = 1: length(csv.headers)
    if n == 1
        csv.data{1} = csv.rawdata{1};
    else
        csv.data{n} = csv.rawdata{(n-1)*2} + j*csv.rawdata{(n-1)*2+1};
    end
end
% csv.headers and csv.data are pair for complex data format
idxx = 1;   % idxx should always be 1 for frequency
idxy = 2;   % user select which data to plot with idxy

% plot real and imag
figure;
subplot(2,1,1);
semilogx(csv.data{idxx},real(csv.data{idxy}));
ylabel({csv.headers{idxy},' [Real]'});
xlabel([csv.headers{idxx},' (Hz)']);
title(['Qspice Export csv (complex format) : ',csvfile],'interpreter','none');
subplot(2,1,2);
semilogx(csv.data{idxx},imag(csv.data{idxy}));
ylabel({csv.headers{idxy},' [Imag]'});
xlabel([csv.headers{idxx},' (Hz)']);

% plot dB and phase in degree
figure;
subplot(2,1,1);
semilogx(csv.data{idxx},20*log10(abs(csv.data{idxy})));
ylabel({csv.headers{idxy},' (dB)'});
xlabel([csv.headers{idxx},' (Hz)']);
title(['Qspice Export csv (complex format) : ',csvfile],'interpreter','none');
subplot(2,1,2);
semilogx(csv.data{idxx},unwrap(angle(csv.data{idxy}))*180/pi);
ylabel({csv.headers{idxy},' (degree)'});
xlabel([csv.headers{idxx},' (Hz)']);
Could you explain more simply how (real, imag) is related to db and phase in this case on how generated data in csv file looks like? I want to know how you converted exported data from qspice (given as it is generated default) to db and phase.
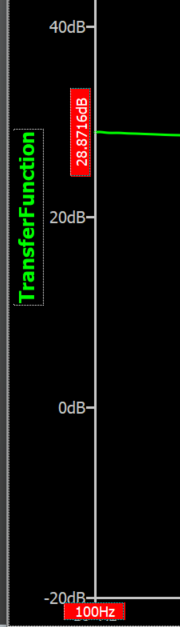
From this to db and phase:
I have a slide in my General Reference Guide explaining this.
By the way, use text editor to open .csv file. Standard open from excel will not give you imaginary part, as there are two format of delimiter in complex format Qspice .csv
Ok, good, thank you.