We have designed UWB location system, which is a point-to-point ranging system and has already been commercialized. But it seems to have some problems, such as distance have large jumps in certain special places, so we are doing some UWB testing.
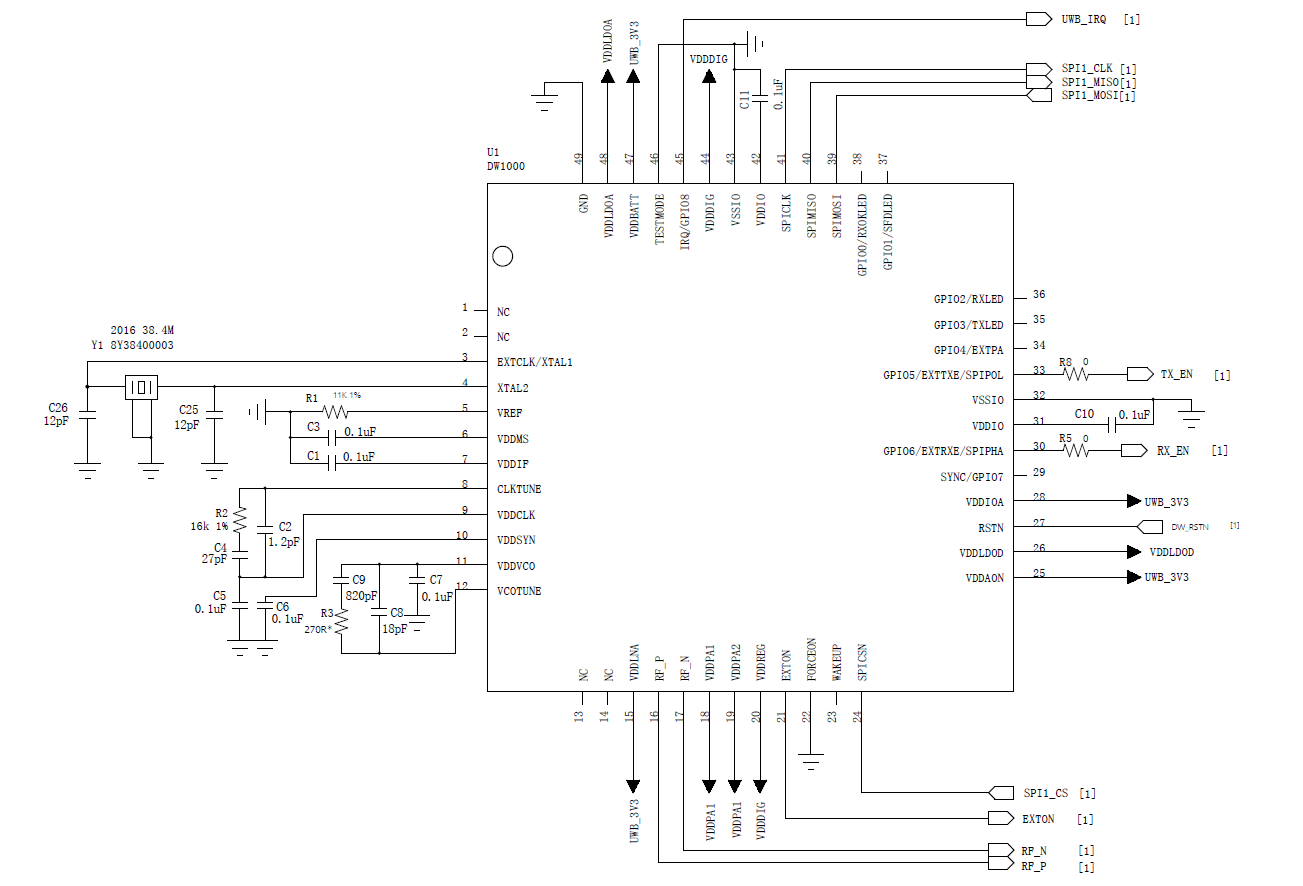
This is our anchor-tx-sch:
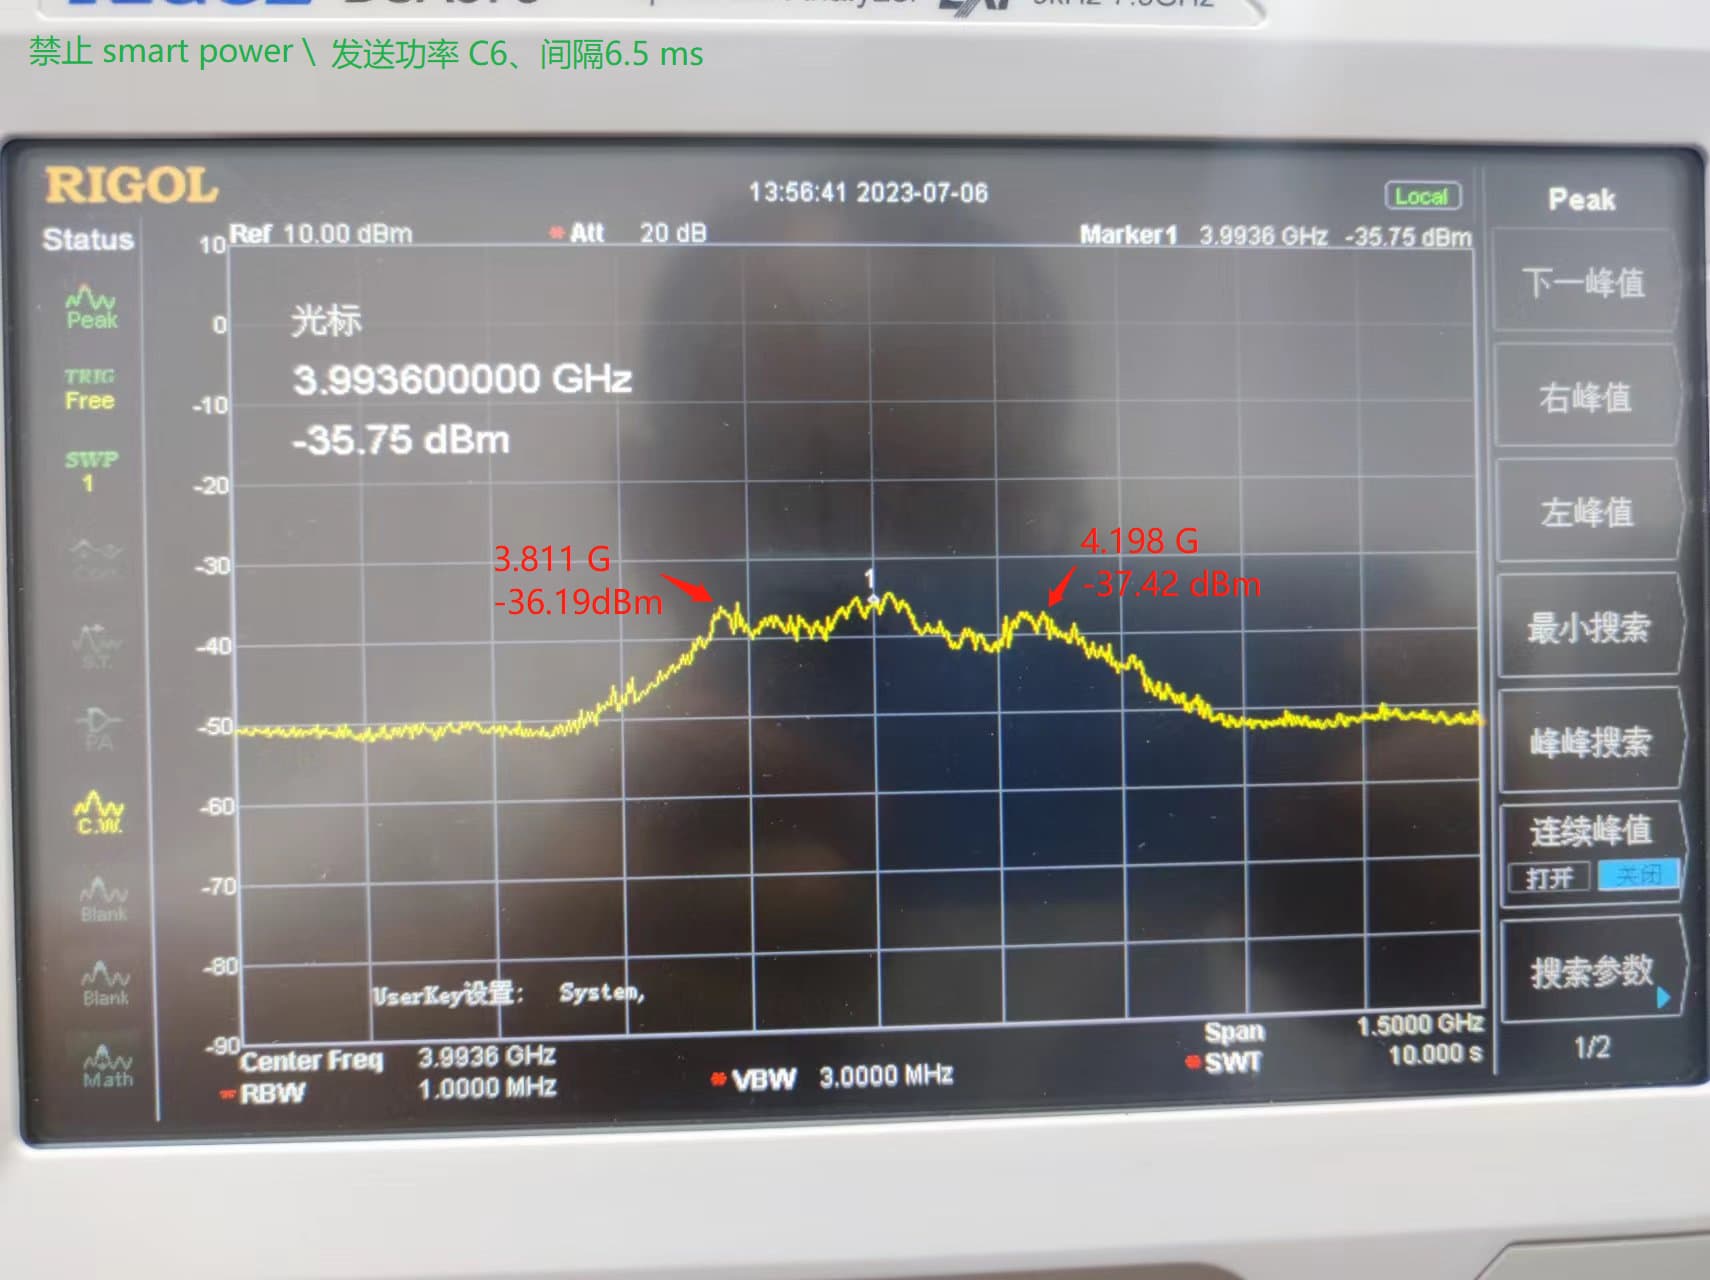
We connect SMB to interface of Spectrum Analyser through 25 cm RF feeder. When smart tx power is disable, tx power register is set to 0xC6C6C6C6,period of sendding data is 6 ms. Other parameters is :
We connect SMB to interface of Spectrum Analyser through 25 cm RF feeder. When smart tx power is disable, tx power register is set to 0xC6C6C6C6,period of sendding data is 6 ms. Other parameters is :
2, // channel
DWT_PRF_16M, // prf
DWT_BR_6M8, // datarate
4, // preambleCode
DWT_PLEN_128, // preambleLength
DWT_PAC8, // pacSize
0, // non-standard SFD
(129 + 8 - 8) //SFD timeout
I do not know is the tx power spectrum correct getted from Spectrum Analyser ?
The ideal power spectrum would be a rectangle, -1000 dBm up until the minimum frequency, -41.3 dBm over the full UWB band and then -1000 dBm above the band. That would give the most energy possible within the band while keeping the peak below the upper limit of what is allowed.
Obviously this is completely impossible in the real world but the aim is to get the spectrum as flat as possible within the band. That give more energy in band which means more range. A bell curve as you seem to be expecting would give far less energy in the band and so have a shorter maximum range.
Thank you very much, AndyA!
Because we use channel 2 which bandwidth is 499.2MHz, so is the tx power spectrum correct if the frequency range getted from Spectrum Analyser is between 3744 and 4243.2 MHz [3993.6 +/- (499.2/2)MHz] ?
Additionally, the maximum tx power is -41.3 dBm/MHz according to the user manual. How can i calculate the maximum the tx power when we use the channel 2?
Yes, that’s the band it should be using.
The transmit power limit is an average of -41.3 dBm/MHz averaged over 1 ms. There is also an peak maximum of 0 dBm/MHz but it’s normally the average that’s the limiting factor.
You set your spectrum analyser to 1ms per point (normally by setting the sweep time to being the number of points multiplied by 1 ms). You set your system to constantly repeat it’s worst case transmit load for a 1ms period (normally your largest packet send once per ms). You then ensure that at no frequency do you exceed that maximum. So if you have a resolution bandwidth of 1 MHz on your spectrum analyser the limit would be -41.3 dBm, if you have a bandwidth of 10 MHz then it’s going to be -31.3 dBm (10 times the power over 10 times the frequency range).
As should be clear from the above, a wider resolution bandwidth will in effect allow you to average the signal level over a range. If the signal was completely flat over the band this wouldn’t matter but it isn’t and so wider is better since it averages out any peaks more. The regulations allow you to use a resolution bandwidth of up to 50 MHz, assuming your equipment can do that then that’s what you want to do. If your equipment can’t do that (it’s not a standard option) then find a test lab that can when it comes to your final approvals testing.
There are application notes on the certification process. If in doubt use a test lab with UWB experience that knows what they are doing. All of our approvals are normally done with a local lab, our UWB system ended up going to a completely different lab in a different country for the approvals.
Hi @rainDecaWave
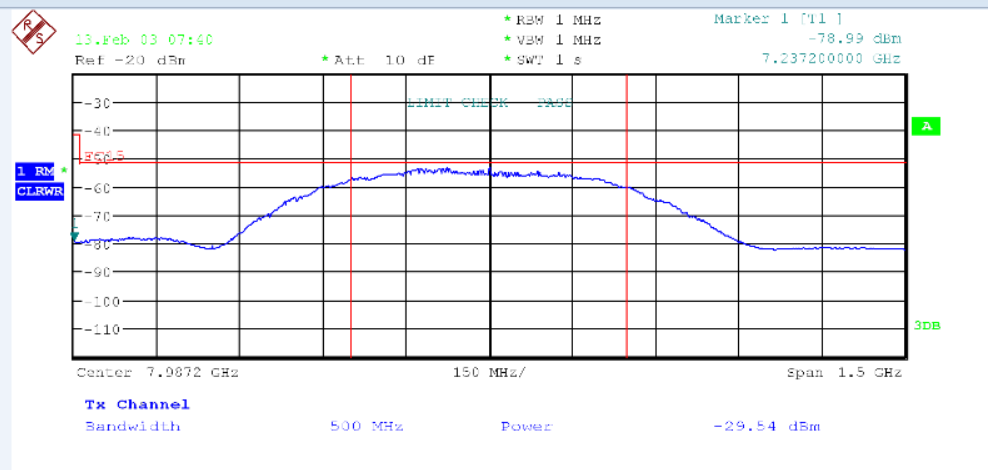
in my point of view there might be something wrong with your TX spectrum. You should get smooth plot - dont have a plot for DW1000 but below is a plot from DW3K which looks similar (just the frequency is higher).
Also your noise floor is a bit high? How the plot looks like without connected SMA and with att = 0dB?
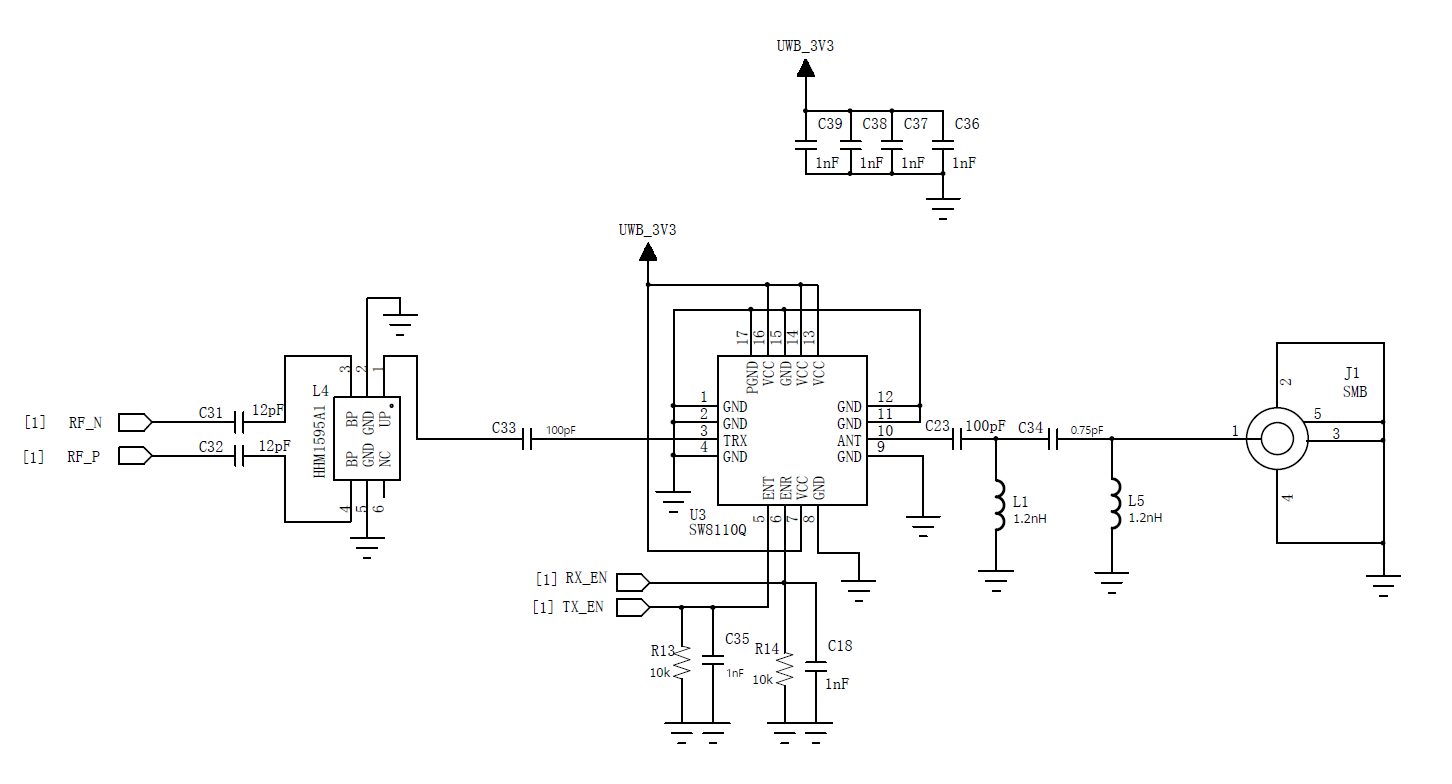
If you are looking for -41.3dB limit why do you have there PA? The DW1000 can itself radiate at that limit and the PA is not needed.
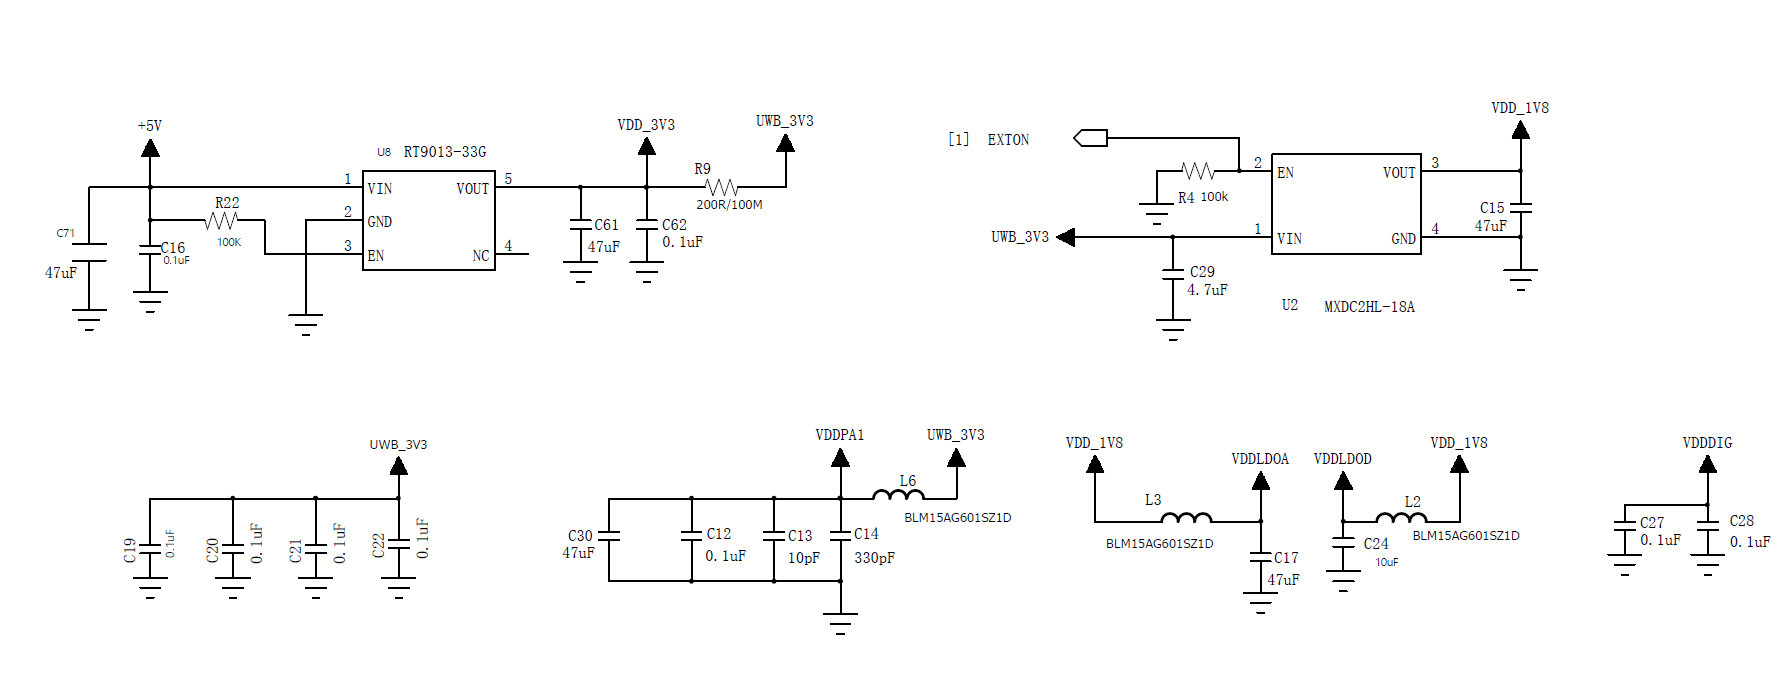
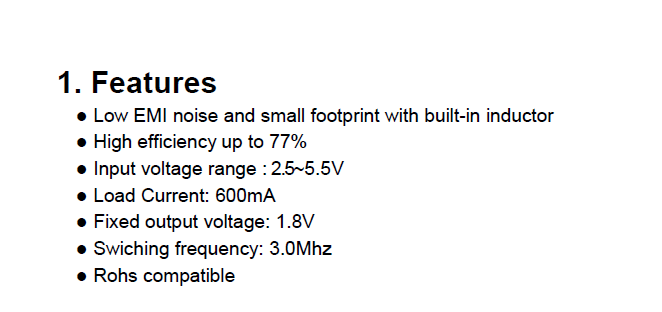
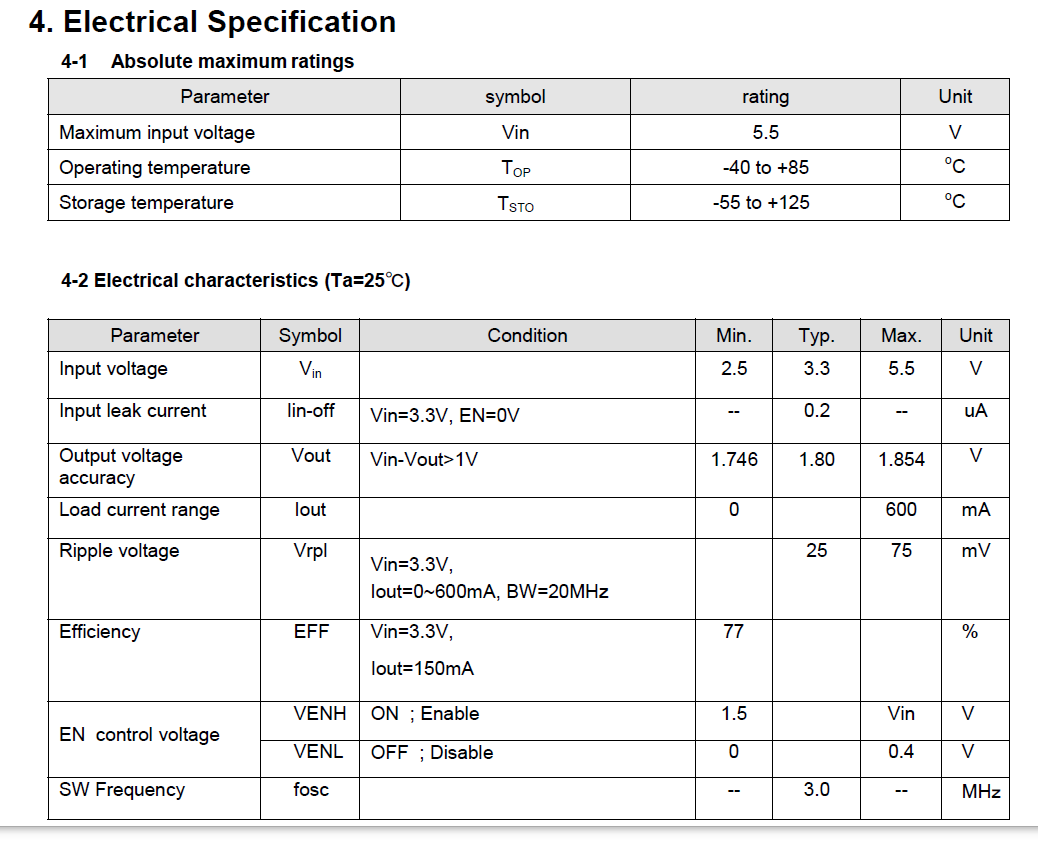
Im could not find the MXDC2HL-18A datasheet but it must be hi speed LDO + the same for the 3.3V LDO.
I do not have experience with out LNA/PA but they are typically very sensitive to any noise in power path - I would recommend to add a LDO for it + bunch of higher/smaller caps.
Thank you very much, leapslabs!
This picture looks very beautiful, and I believe the range effect is also excellent. If we want to obtain this good plot, we may need to do more testing and improvement.
The attachment is the datasheet for MXDC2HL-18A.
Is the higher noise floor due to the presence of PA, the PA amplifies the entire signal including noise? We use PA to obtain a larger distance, approximately 300 meters.
We are currently testing whether it is necessary to continue using PA, and if not, we will cancel it in the future.
Thank you for your suggestion!