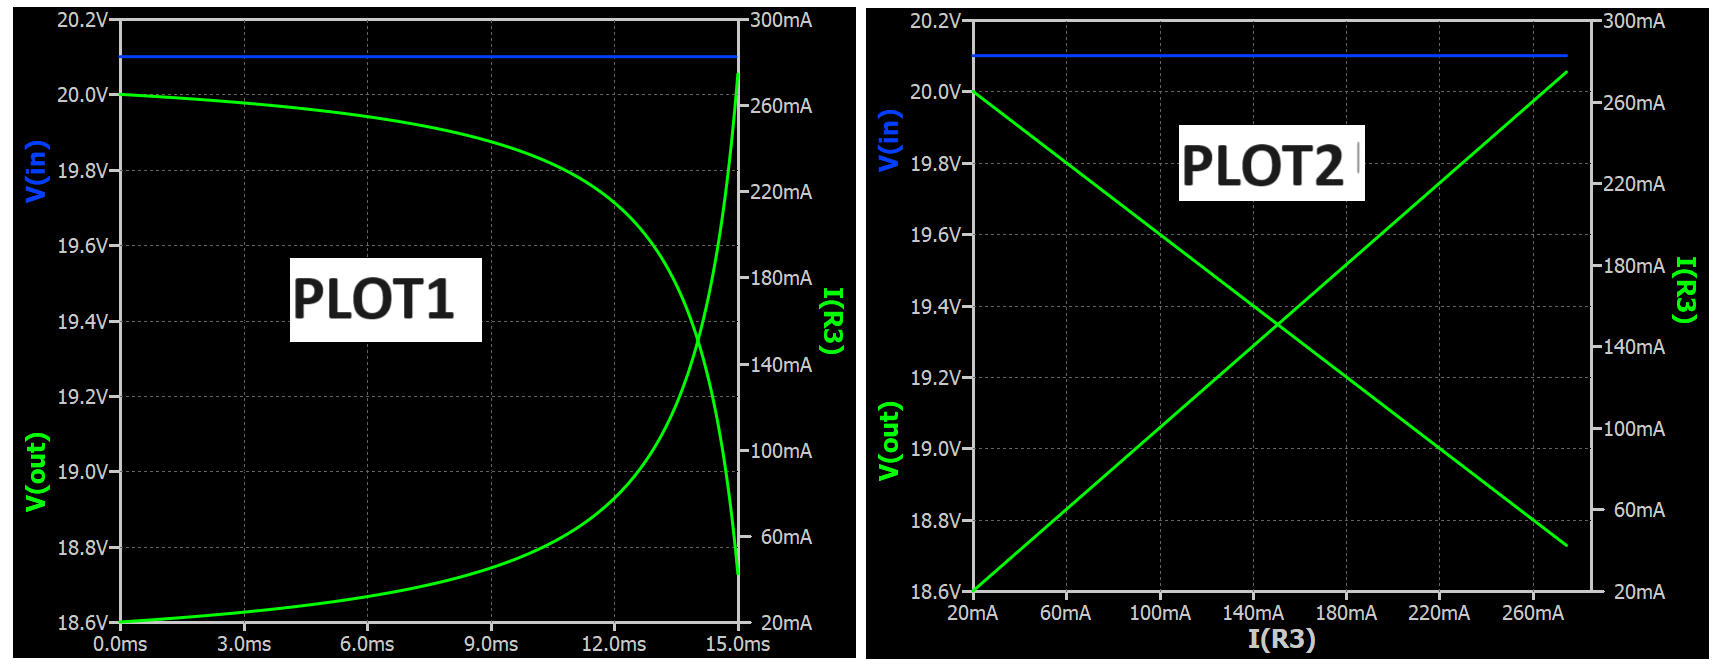
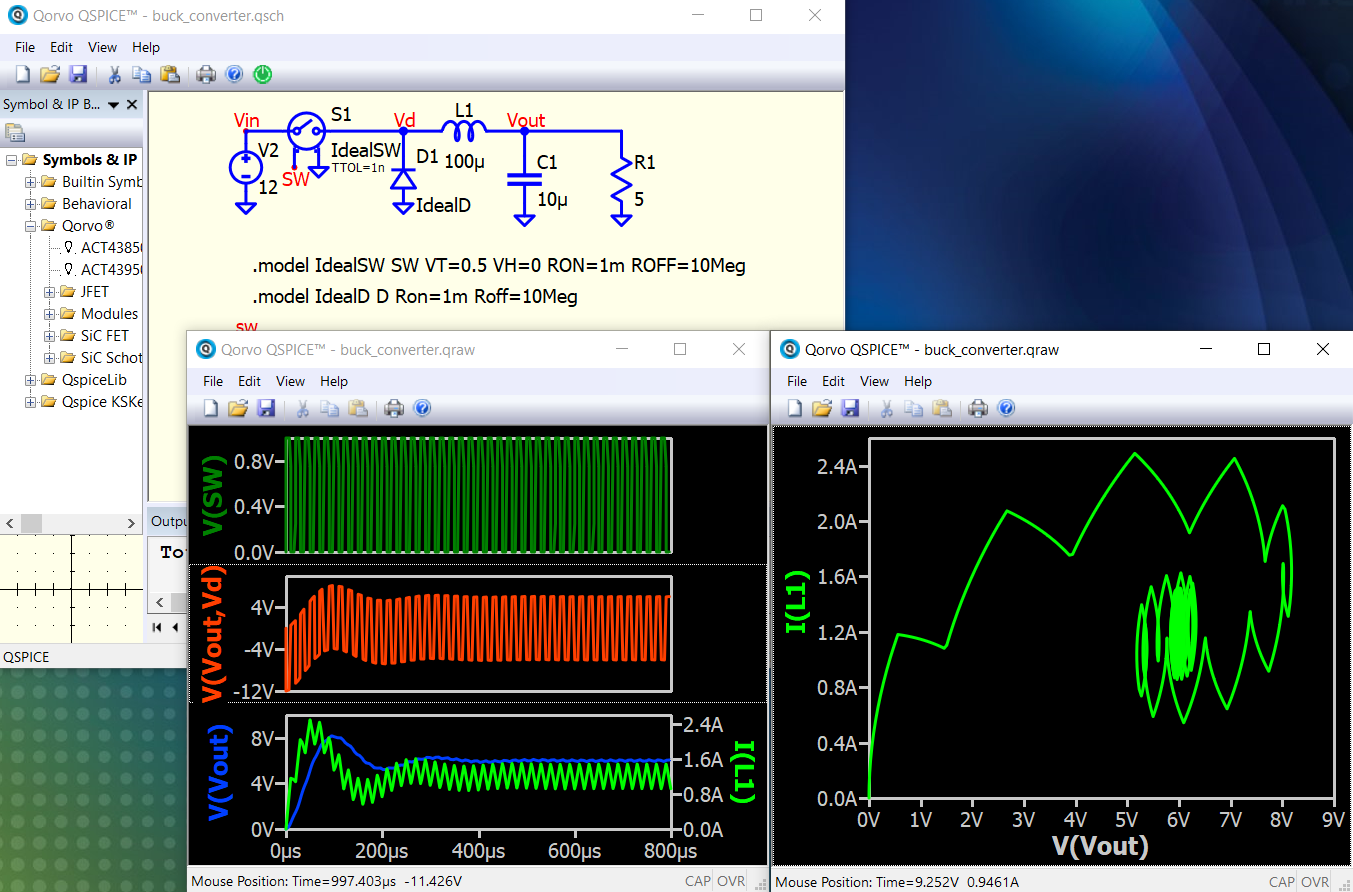
You cannot do it in a single waveform viewer, but you can do it by using two waveform viewer side-by-side.
File > Open, in file type : waveform file (.qraw)
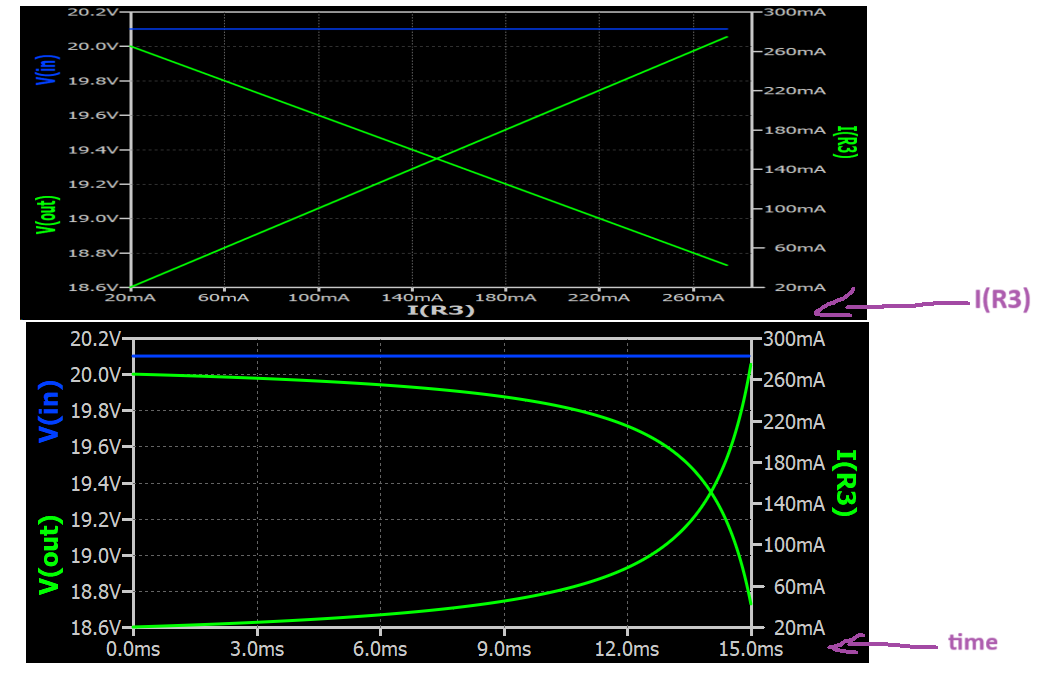
you can open a new waveform viewer by loading same waveform file to setup with different x-axis parameter.
But the waveform viewer created with this method will not update in next simulation run. Only one active waveform viewer window get auto update.