What does the data in acc_mem mean? How is it calculated to get it? Is there a formula? I don’t see it in the documentation.
Is this normal for a graph?
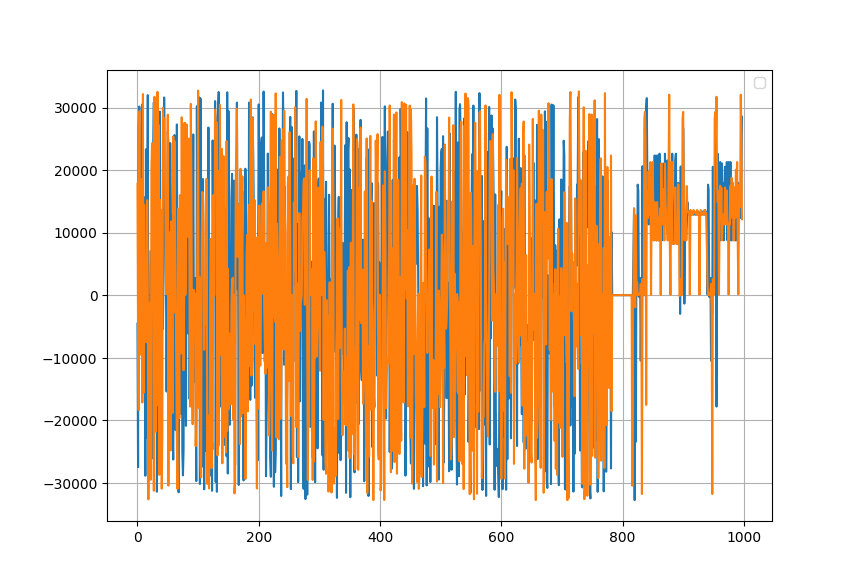
That doesn’t look quite right.
Normally all you want to look at is the magnitude of the values, sqrt (I^2 + Q^2).
If you do that and plot ideal world data (empty field, no other noise or reflection sources etc…) then you will get a very low level until around bin 740 and then a sharp spike before returning to almost zero. The location of the spike should match the value in the first path location register and the size should match the first path peak register. These numbers may not be exactly the same due to the processing the chip does but they should be very similar.
In the real world you will get lots of spikes and noise after that first peak, those are reflections arriving at the antenna. Significant variability or spikes before an index of around 740 is normally indication of high background noise or jamming sources. In some situations (very long / large indoor areas) you can also see spikes there due to reflections bouncing around for a long time.
1 Like
Hi, AndyA
I want to express my gratitude for your helpfulness. Your assistance has been greatly appreciated.
Here is my code:
void UwbReadAccMem(void) {
dwt_readaccdata(uwbAccMem, 4065, 0);
}
In Rx complete:
UwbReadAccMem();
dwt_rxenable(DWT_START_RX_IMMEDIATE);
On PC, I use Python to process the data
def bytes_to_complex(bytes_data):
complex_list =
for i in range(0, len(bytes_data) - 40, 4):
int_1 = int(bytes_data[i]) + int(bytes_data[i + 1]) * 256
int_2 = int(bytes_data[i + 2]) + int(bytes_data[i + 3]) * 256
int_1 = convert_unsigned_to_signed(int_1)
int_2 = convert_unsigned_to_signed(int_2)
complex_list.append(complex(int_1, int_2))
return complex_list
def convert_unsigned_to_signed(unsigned):
if unsigned & 0x8000: # Check if the most significant bit is 1
signed = unsigned - 0x10000 # Convert to signed by subtracting 2^16
Else:
signed = unsigned
return signed
Would you please give me some advice on where I may be wrong?
Thanks again.
The first byte in any read from acc mem is always junk data. Change your for loop to start at a value of 1 rather than 0.
1 Like
I deleted the first byte before I sent it to the PC. Also, I tried starting the index from 1 to 4, but the range of data didn’t change like noise between -30000 and 30000.
Hi, Andy
I believe I know the reason.I am using a ring buffer size of 256 bytes in SPI DMA, so it is not possible to read 4095 bytes from SPI directly.
Thank you for your assistance.
That would do it. At least it’s easy to work around.
Remember if you break the read up into multiple 256 byte blocks then you need to discard the first byte from each block.
1 Like
Thank you for the advice!
I’ve got the correct data. Still, I have some questions about the data.
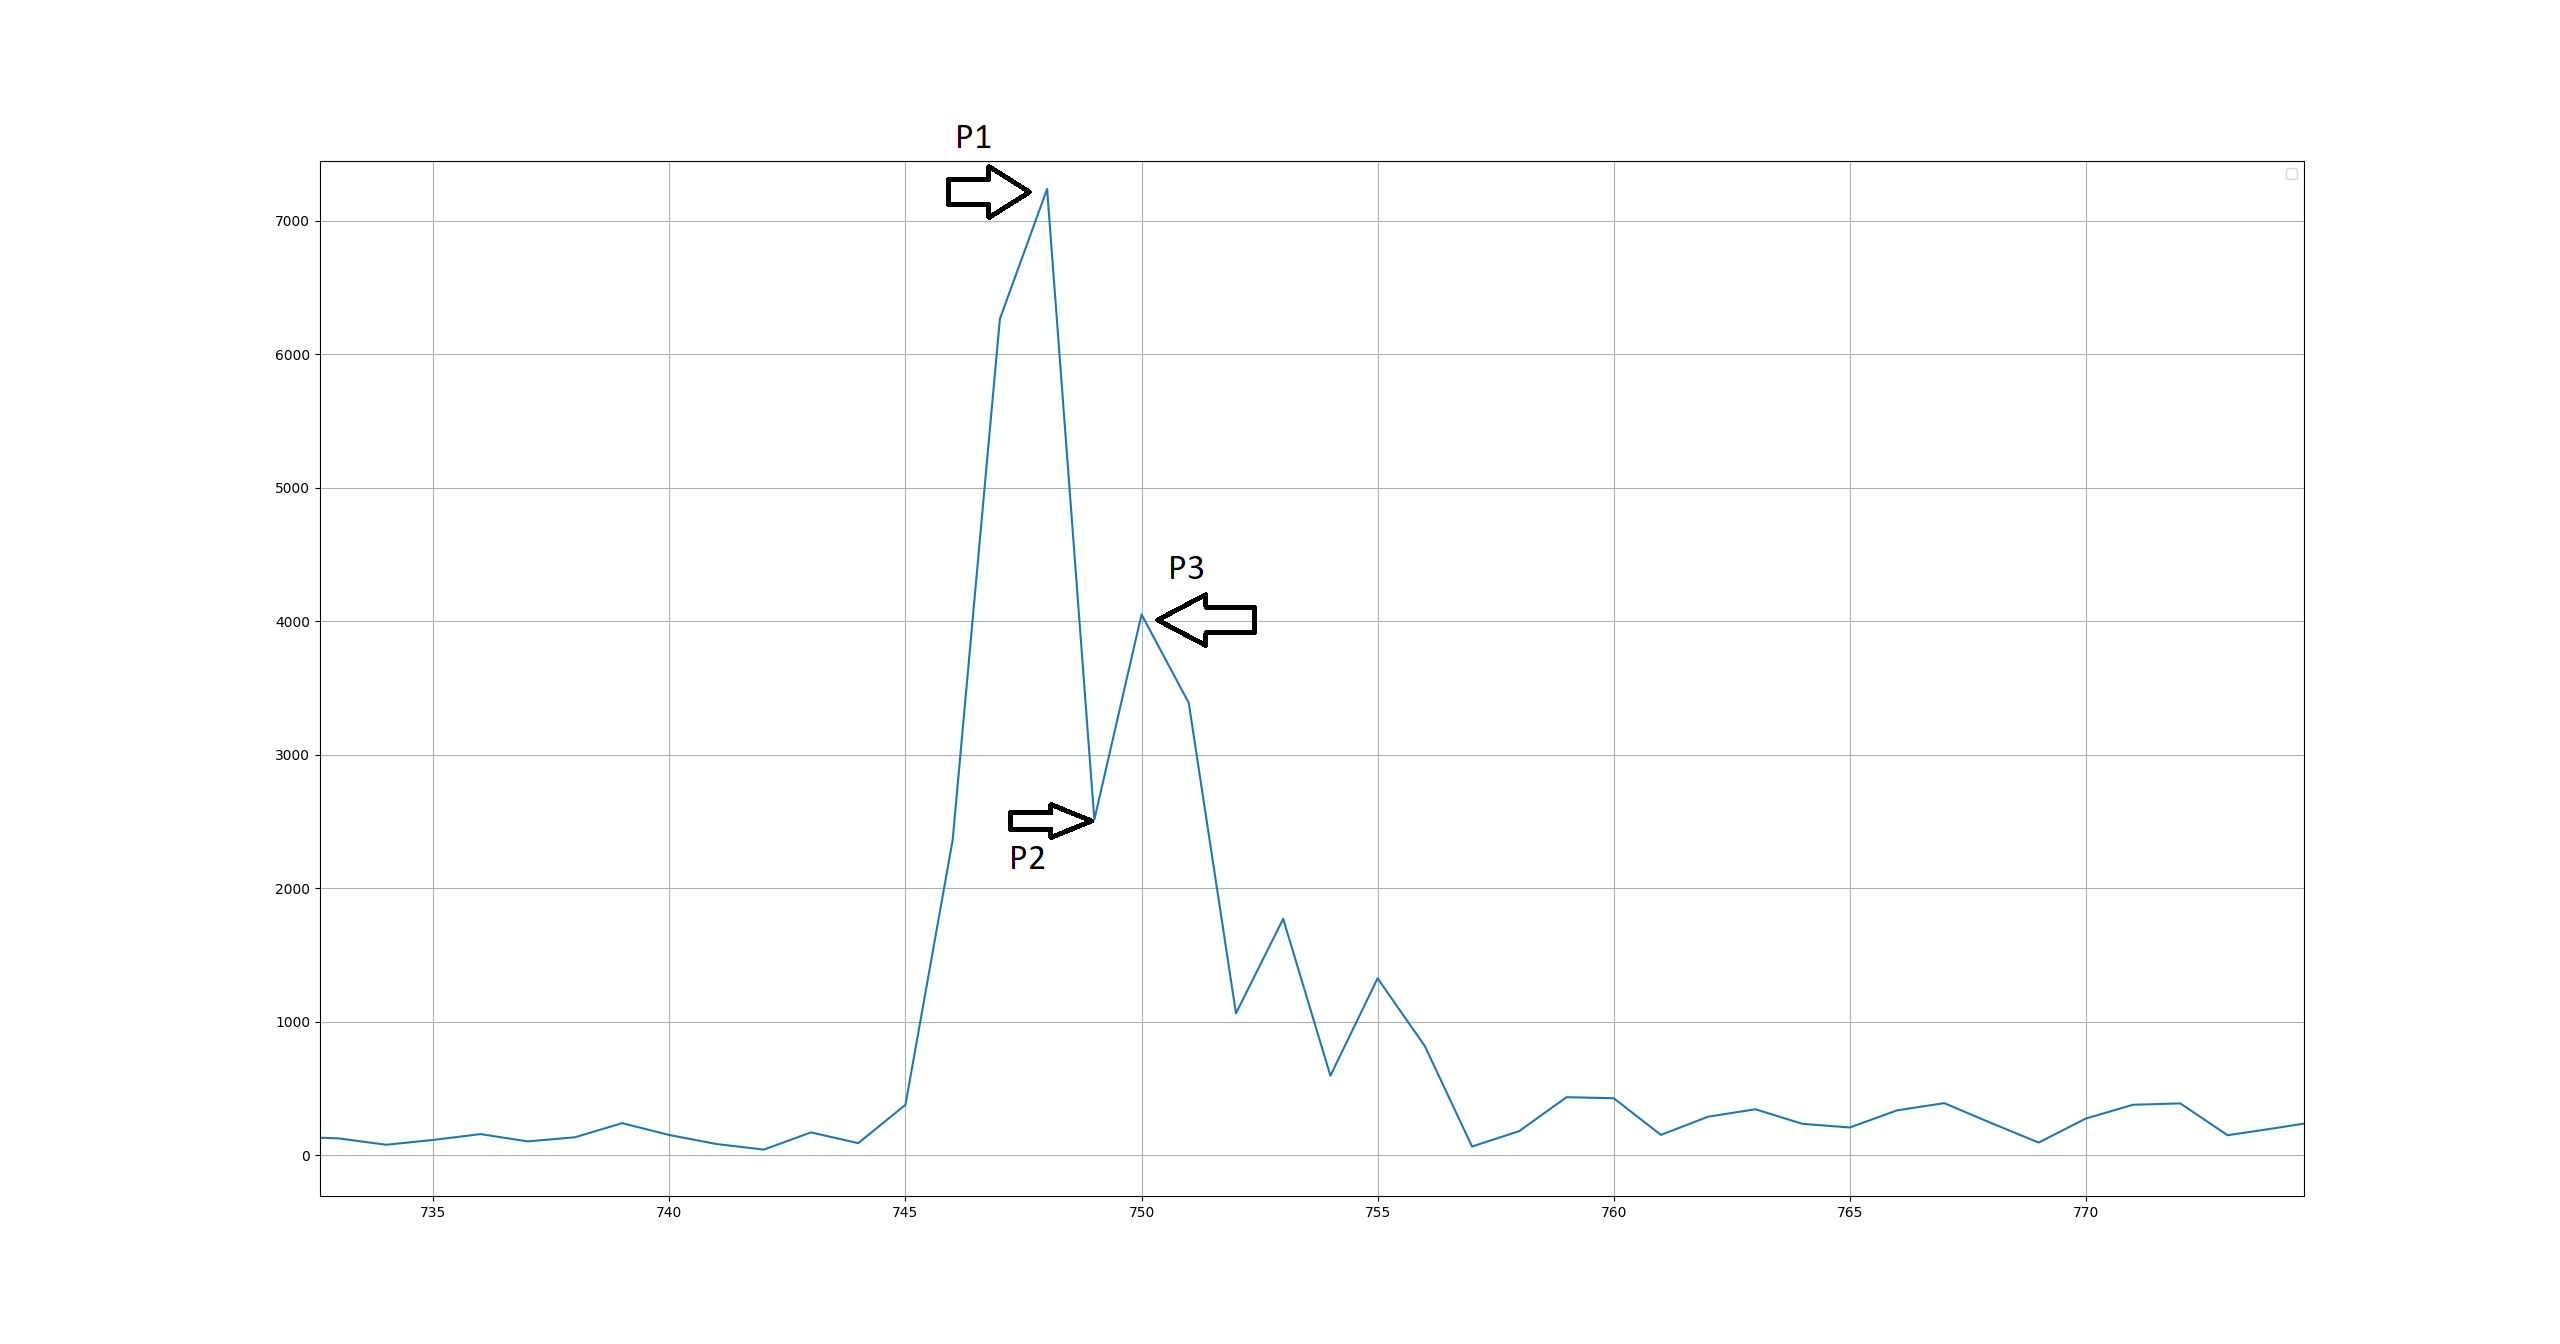
I connect the anchor and the tag through a wire in this image. So, I think there should not be an NOL path. But I see P1 and P3, there are two peaks, which are about 3dB different. How do we understand this? Is there a path in the circuits? I tested them many times, and they are all similar to this.
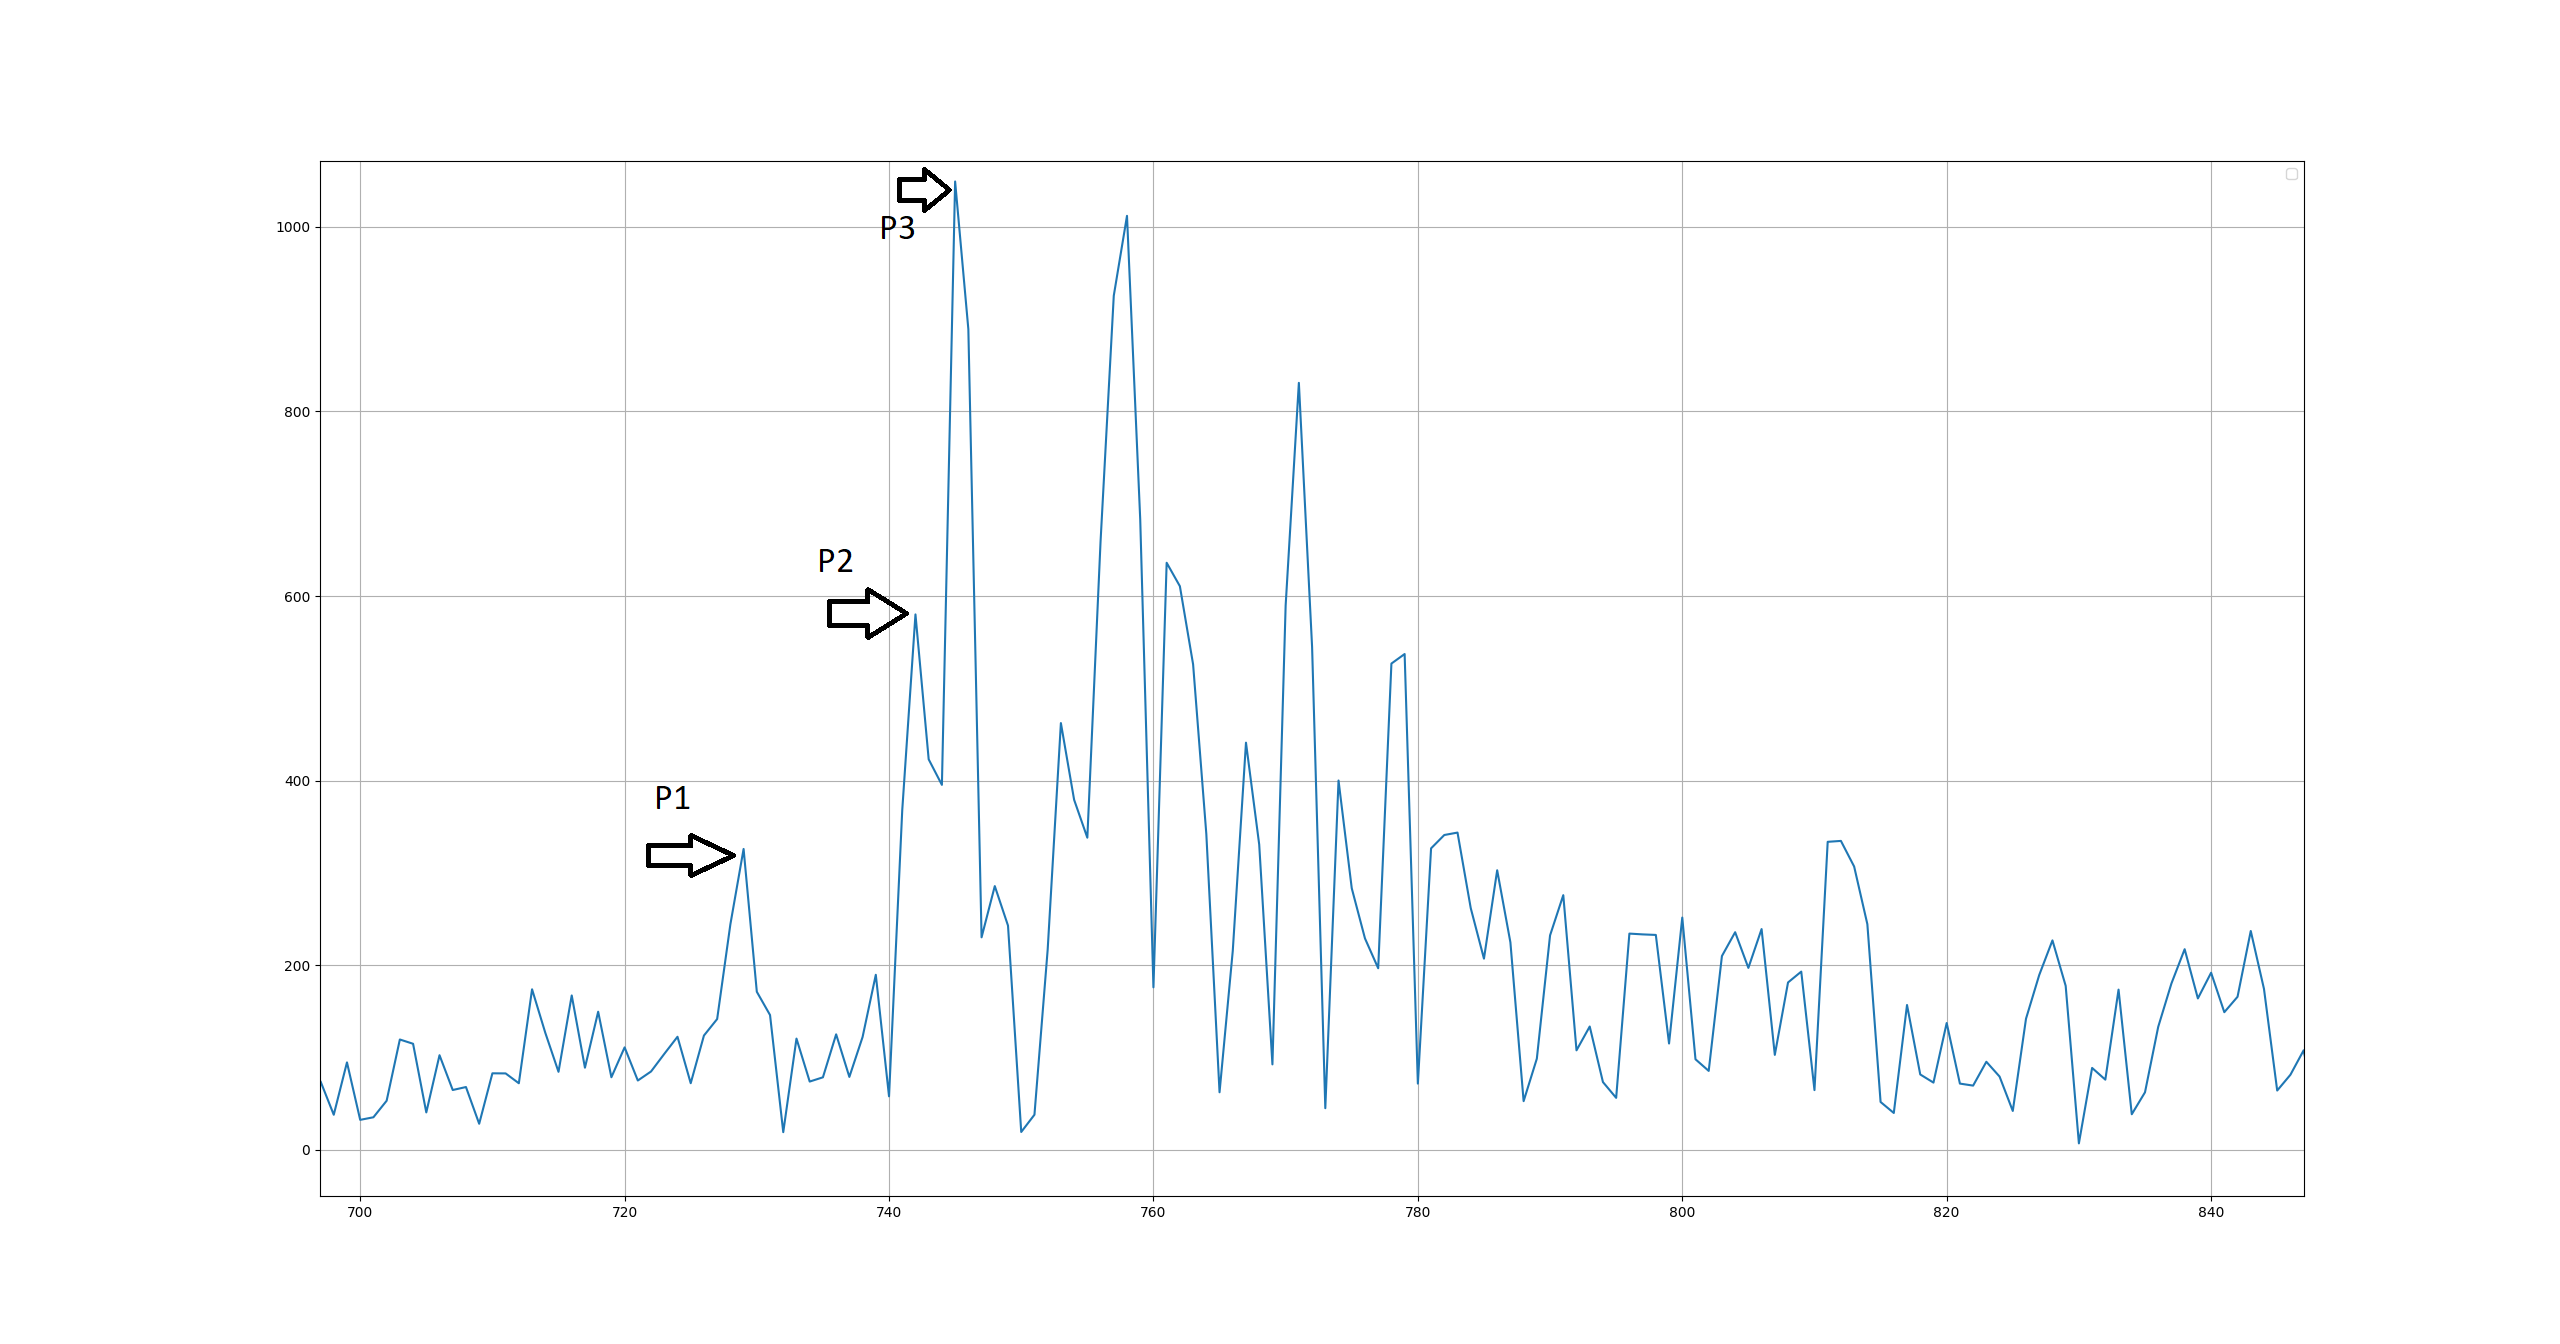
In this image, I test in a wireless circumstance, and there is nothing between the antennas. In this graph, I can see two peaks before the highest one. And so, how do we understand this?
For the first image - who said you can’t get reflections in a cable? Every join or component will create an impedance change of some sort, that’s all it takes to create a reflection.
For the second image - Which peak is getting detected as the first path and is it giving you the correct range?
I’d say P2 is the direct signal and P3 a reflection.
It’s not uncommon for reflections to be stronger than the direct path. Only a tiny portion of your signal energy travels the direct path. If a couple of reflection paths happen to be the same length then the reflections can easily be stronger. That is why it’s important for UWB radios to use the first path not the strongest path when calculating range.
P1 is a bit of an oddity, I’m going to make a random guess here, let me know if I’m correct:
You have the antennas attached by cables that are around 1.5m long.
I’ve seen something similar before when I had antennas on cables. When close the range measurement would show a step change to a shorter distance, in effect the system switched from using P2 to using P1 as the first path. At close range the leakage from the parts and cables was sufficient that the system was picking up the leaked signal as the first path and skipping the cable.
P1 to P2 looks like ~12ns which is ~3.6 m in the air. Allow for signals to travel a little slower in cables and ~3 m of cable being skipped would give that sort of difference. Assuming a 50/50 split thats 1.5m at each end.
You can also get some very strong long lived reflections creating spikes before the main one but they are unusual for an office type environment and it would be quite a coincidence for one of those to be so close to the main signal.
Thank you for the explanation. I will run more tests to check the details.
There are two cables after antennas on both the Tx and Rx sides. Near the antenna is a 1m cable and then a 3m cable.
Odd that the numbers don’t quite add up. Any sharp bends in the cable? I’ve also seen the same effect when there was a bend in the cable that increased the leakage in that area. That took ages to find, after adding more and more shielding to the board I finally tried adding a foil wrap to the cable and the issue vanished.
Either way the cables are almost certainly the explanation for P1.