Hi all,
I would like to import the transfer function of a filter i measure with Bode100 to QSpice to use for simulation. I cannot find any way to do this. Can you advise me on this topic?
Regards,
Samo
Hi all,
I would like to import the transfer function of a filter i measure with Bode100 to QSpice to use for simulation. I cannot find any way to do this. Can you advise me on this topic?
Regards,
Samo
Bode100 is a VNA. Are you saying you measured the gain/phase vs frequency data and would like to use that data into simulation? Transfer function from a dataset instead of s-domain laplace equation?
What I want is an S-parameter block with n ports and s-parameter file
name, given the RF portfolio of Qorvo. The VNA is simply on the table
every day.
C goes better with vhdl, verilog and things like modelsim. Nothing against
it here, but these are my preferences.
And I love C since Unix V6 on a pdp11/45.
regards, Gerhard
Yes, I want to use the gain / phase measurement and import it into simulation. This is possible in LTSpice using the FREQ function however this does not work in QSpice. Is there a differet way to do this is QSpice?
The FREQ function in LTspice appears to be an undocumented function that can be used to model gain and phase, but I have no personal experience with it.
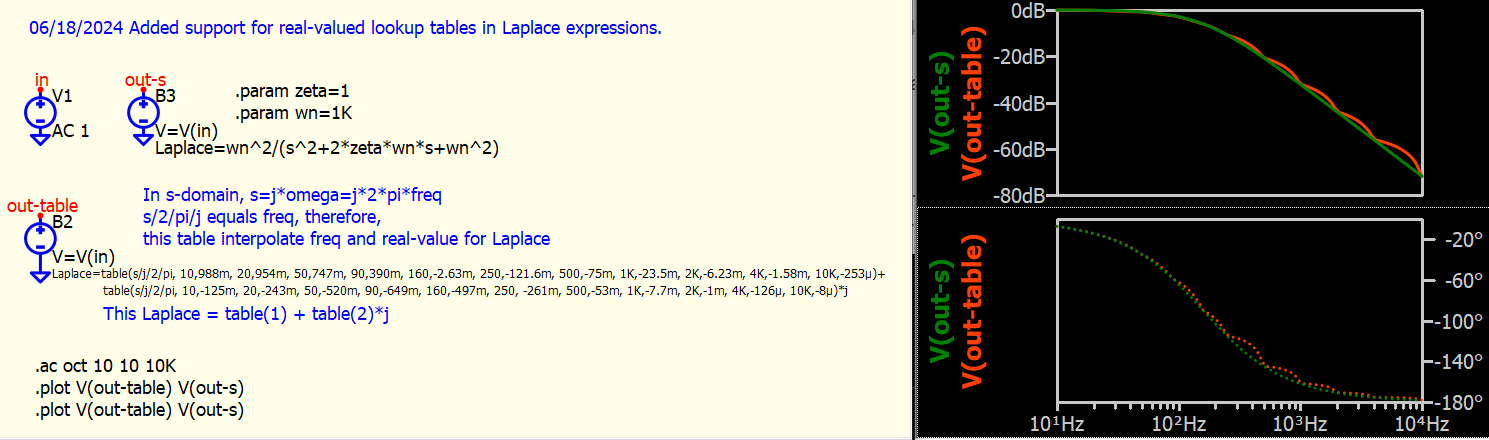
In the update on 18-June-2024, Mike added support for real-valued lookup tables in Laplace expressions. What you need to do is that, convert gain/phase vs freq data into real/imag vs freq data. Set Laplace with two table (one for REAL and one for IMAG) to model Laplace as R+jX vs frequency.
As a remind, Laplace with table can only used in .ac but not .tran. In .tran, it will return an error : “Can’t numerically factor this Laplace expression”.
Hi!
In a tradeshow (I remember APEC this year), I saw a prototype of Bode100 suit software providing a “model fitting” into simple RLC networks.
Thank you all for your suggestions! For the moment I will continue to use LTSpice for this specific functionality.
You can use System Identification to extract the transfer function from a bode plot to create the transfer function equation which you can use in simulation i.e laplace equation.
The toolbox in Matlab is expensive but has a nice capability to read you bode plot graphic or csv data of the bode plot. Some free application like octave or scilab have these capability. I think python has a library for system id as well.
@samosmodis The B-source with FREQ has just been implemented in Qspice. Please refer to this post for reference : FREQ function as LTspice equivalent - QSPICE - Qorvo Tech Forum