Hi,
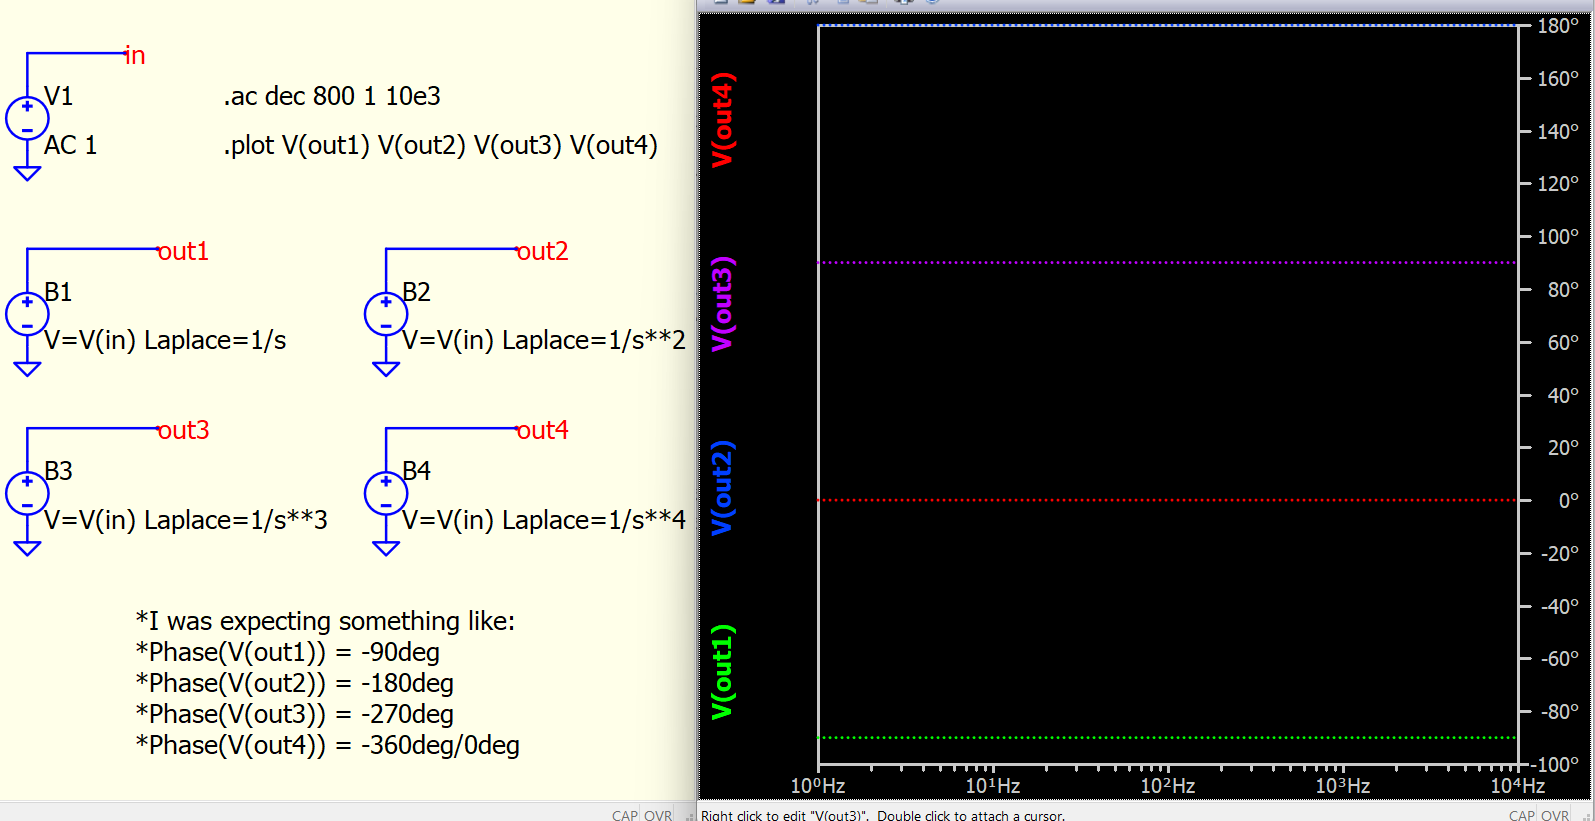
How the phase is calculated in qspice?
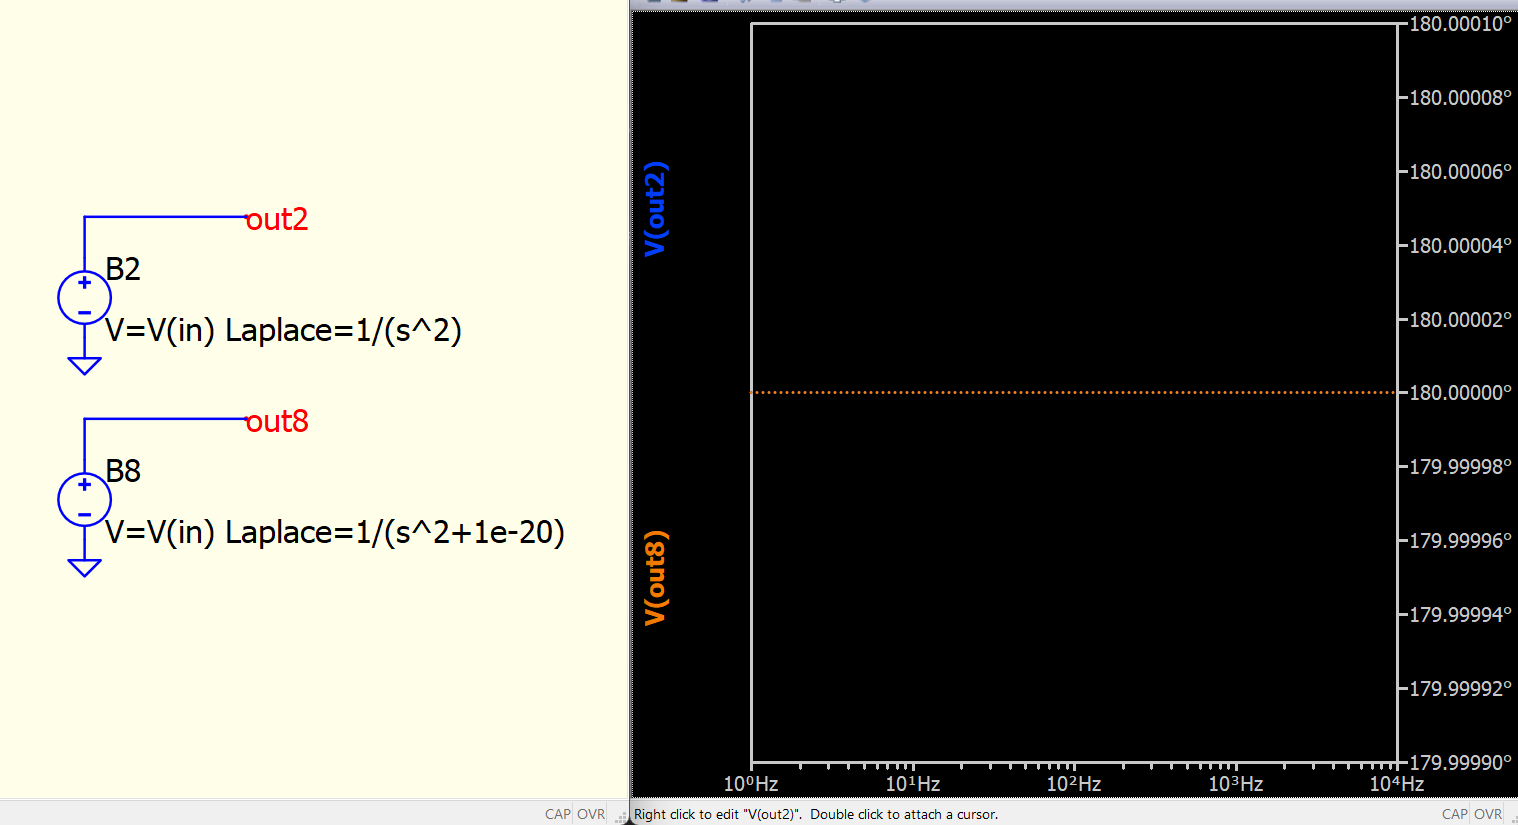
Phase_Simple_Circ.qsch (4.7 KB)
Possibly you find a bug in Qspice, when only 2nd-order, 3rd-order… is in denominator.
[Correction : this is not a bug, as 180 degree = -180 degree]
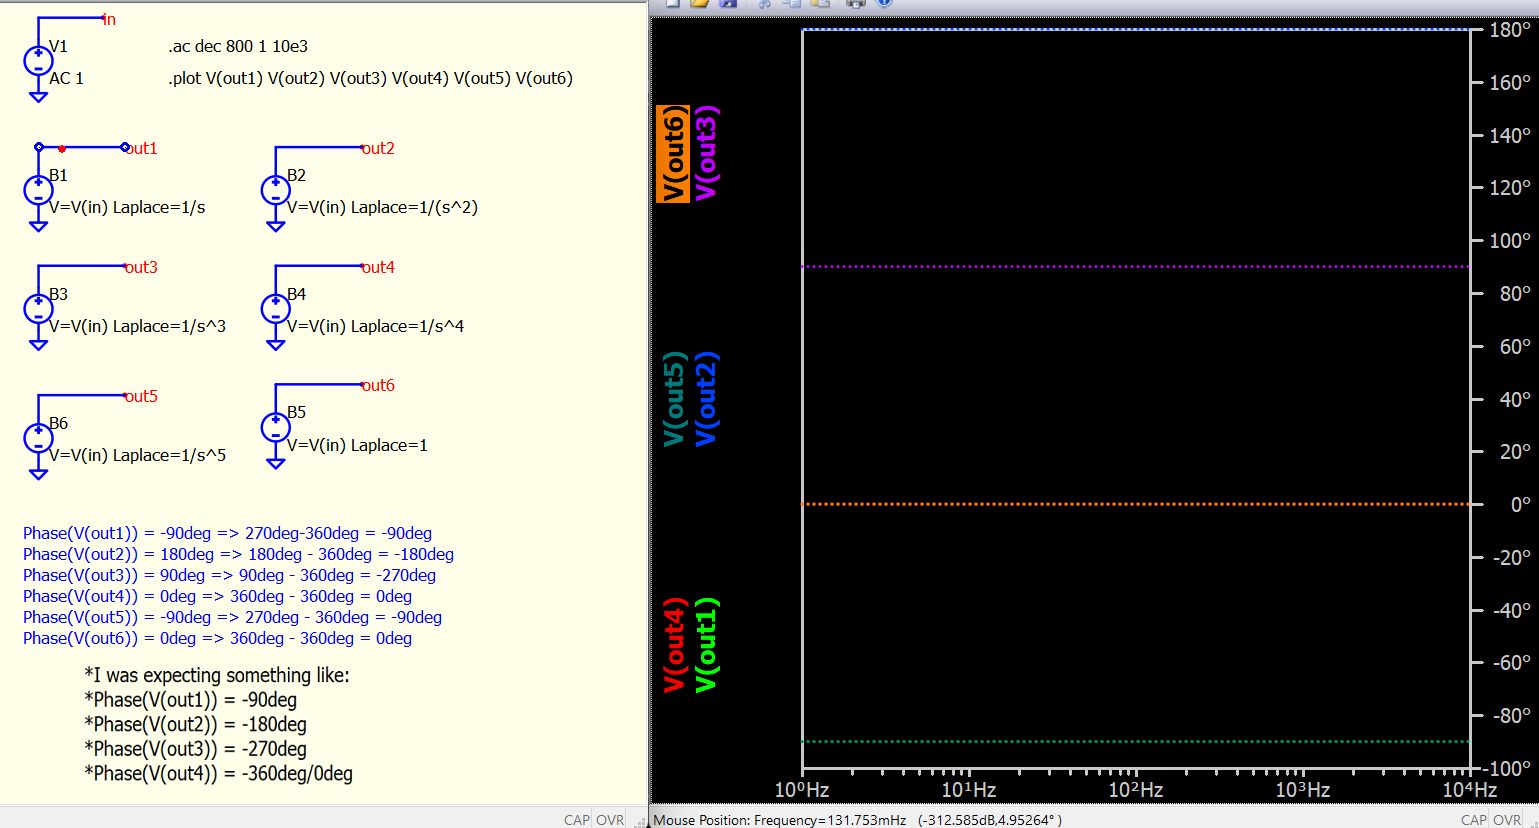
Kevin look: it seems that we need to extract a -360deg in order to obtain the expected phase values:
Phase_Simple_Circ.qsch (549.6 KB)
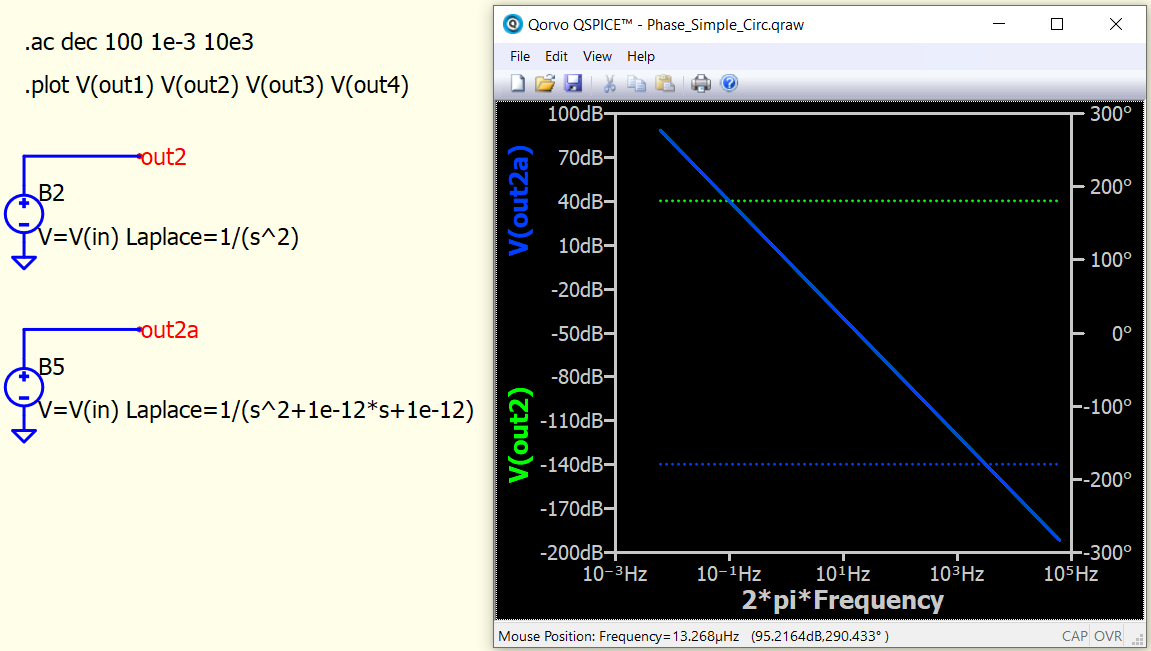
What is the correct plotting on time axis: plotting Phase/Magnitude vs Frequency or plotting Phase/Magnitude vs 2piFrequency?
![]() my stupidness, 180 degree = -180 degree.
my stupidness, 180 degree = -180 degree.
standard x-axis is in Hz for .ac. But in my plot, I changed x-axis expression to omega = 2*pi*frequency as I was running a matlab plot to compare. Matlab plot gave me -180 degree for 1/s^2, and 1/(s^2+1e-12*s+1e-12) also gives -180 degree in Qspice, and my brain is not responding that + or - 180 degree are exactly the same.
this possibly just related to how phase wrap is performed in Qspice code.
But I think 1/s^2 is different than 1/(s^2+1e-12*s+1e-12) in terms of phase (the magnitude are the same).
In order to have for both -180 deg as phase:
Phase(1/s^2)deg - 360deg = -180deg
Phase(1/(s^2+1e-12*s+1e-12))deg - 0deg= -180deg
or if we maintain the substraction of -360deg for both it gives:
Phase(1/s^2)deg - 360deg = -180deg
Phase(1/(s^2+1e-12*s+1e-12))deg - 360deg= 180deg
and as it is plotted by qspice:
Phase(1/s^2)deg = 180deg
Phase(1/(s^2+1e-12*s+1e-12))deg = -180deg
In that example, I was too quick and would like to suggest 1/s^2 = 1/(s^2+1e-12*s+1e-12) [nearly equal] but in Qspice, one give +180 and other -180.
But what I really mess up is that +180 degree = -180 degree, which is same thing!!!
So, there is nothing wrong in Qspice. I was too quick to said it was a bug, but it isn’t. ![]()
Its ok.
or if we maintain the substraction of -360deg for both it gives:
Phase(1/s^2)deg - 360deg = -180deg
Phase(1/(s^2+1e-12*s+1e-12))deg - 360deg= 180deg
and as it is plotted by qspice:
Phase(1/s^2)deg = 180deg
Phase(1/(s^2+1e-12*s+1e-12))deg = -180deg
And how to make this substraction of -360deg in qspice for plot phase only? so as not to be “fooled” by the plot phase values (meaning when the phase is normally negative, the plot in qspice shows positive values)…
I know that 180deg = -180deg, but I think its better to not changed this
I understand in general to prefer 1/(s^2) with -180 degree instead of 180 degree.
But beside of a pure high-order single denominator, do you find any example which give you a phase plot with a phase wrap result not that “common”?
Phase plot can go positive, it just more common to go negative in control system.
I understand, but I want to see 1/(s^2) with -180 degree, so from the phase we need to substract -360 degree. It’s just so that the graph doesn’t fool you, look at the graph and see that it’s positive when the graph should normally be negative.
Can something like this be done for verification with a .meas in which -360 degree is subtracted from the phase plot values that are showing now in qspice, even if the graph remains like it is showing now in qspice?
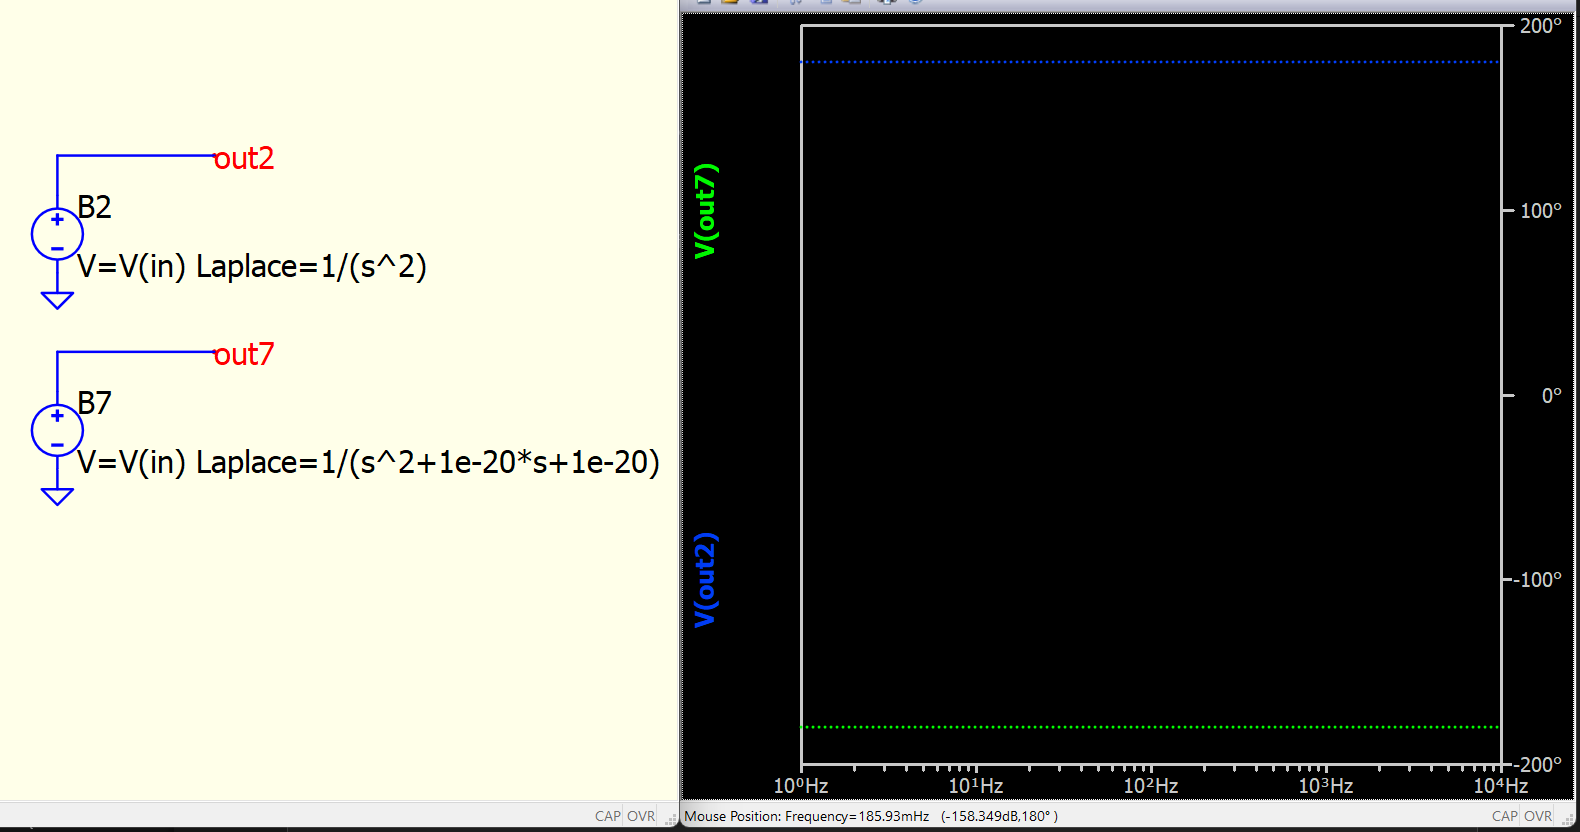
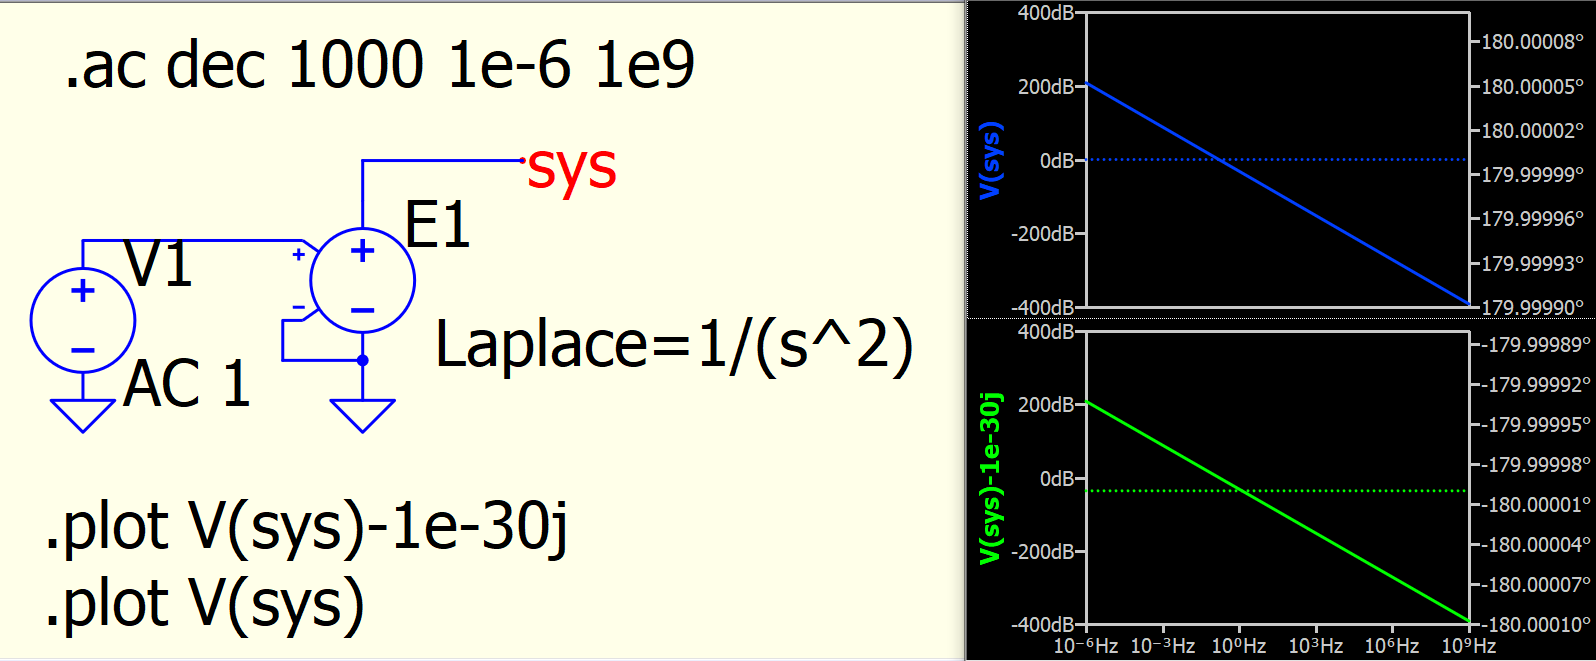
This is an idea you can trick the phase wrap, minus a very small imaginary number, e.g. -1e-30j
Basic idea is that, it seems Qspice tends to plot a pure real negative (e.g. -1) with magnitude 1 and phase +180 degree. 1/(s^2) possibly calculated a pure real negative result and +180 degree is assigned. By slightly adding negative imaginary part to this number, result can flip to -180 degree.
But it is not possible to make a formula, somehow with .meas by which to extract the points on the phase plot and subtract -360deg?