Frequency and magnitude in the same column when I export FFT data to .CSV from Qspice. I was expecting the frequency to be in one column and the magnitude and angle in one column, the same as in LTspice.
I want to plot the.csv data in MATLAB, but I’m struggling with how to fix the above issue or how to plot it in MATLAB by accessing only the magnitude values from the column data which has both Frequency and magnitude.
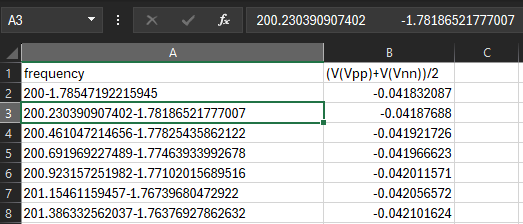
Here is the screenshot from the.csv file. The first column, Frequency, has two elements separated by space or tab. I want to access both elements row-by-row in Matlab. That is, the first element in the x-axis and the second in the y-axis.
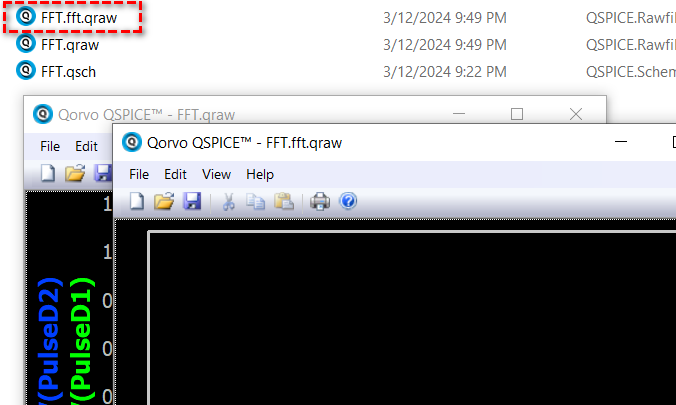
After you run FFT, don’t close waveform viewer and just copy .fft.qraw (you don’t have to export into .csv and can directly play with .qraw file… spent many hours figure out how to load a binary format .qraw so we can play with .qraw in matlab directly).
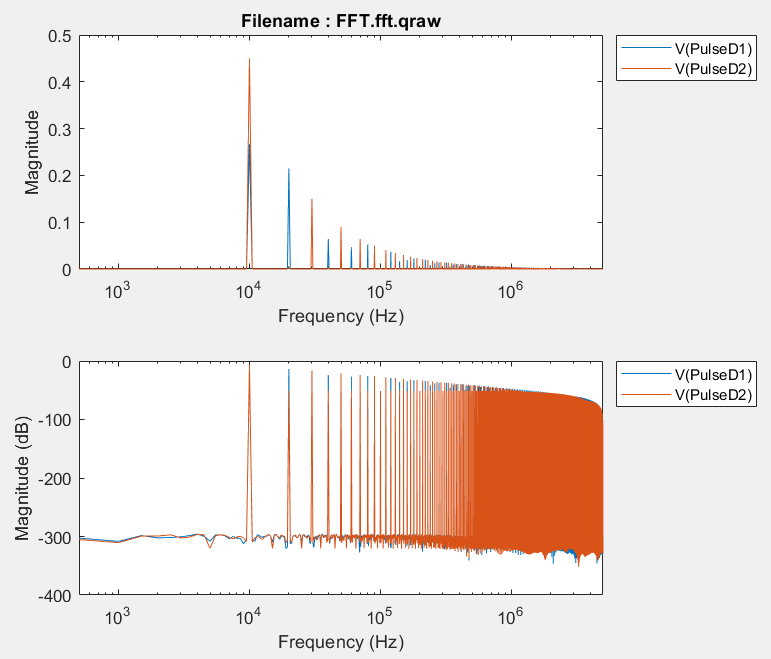
Run Matlab2Qspice_FFT_Qraw.m and read your fft.qraw and you should get FFT plot in matlab.
Yeah, I also experienced this same problem yesterday. The way I solved it is that I exported it as an ASCII file and used the ‘readtable()’ function in MATLAB. It gives you a lot of NaN rows, but you can easily take them out with the function ~isnan(). It would be nice if the numbers weren’t cobbled together in the same column in the CSV file.
My issue is more basic.
The numbers that are in the CSV file don’t make sence to me even for a simple sine wave.
What is supposed to be in the CSV file? Is it real and imag or mag and angle?
I expect you are talking about data in complex number.
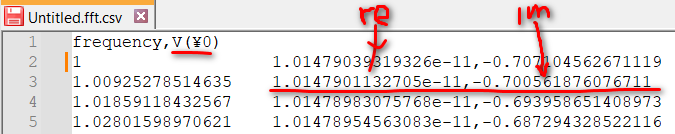
If you export data in complex number (e.g. ac analysis, FFT), except for frequency column (real number), you get REAL,IMAG complex number format. I think this format is not user friendly to excel.
After I see a waveform in the viewer and right click to get FFT, I usually adjust the mag axis to be linear instead of db and I do the same for the freq axis. Then, I try to export the data, I thought the exported data would match what I see and they stay in the same format.
It depends, right-click on the left axis, a dialog window opens up, is it set to polar or cartesian? If its in polar, then it is magnitude and phase, if it is in cartesian, then it is real and imaginary.
Edit: That is in AC analysis, I just realized that you are asking about FFT.
This discussion is about export data format. (i.e. export to .csv file). I think complex data only export as REAL, IMAG currently in regardness of how you set plot axis.