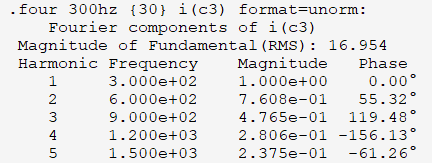
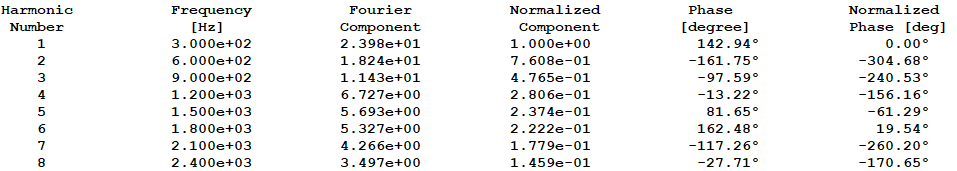
The .four 300Hz {30} I(C3) command outputs the Fourier components of i(c3): fundamental magnitude (RMS), harmonic, frequency, magnitude, and phase.
With this parameter, the Magnitude corresponds to the Normalized Component. How to display a quantity as a Fourier component, like in LTspice or HSpice?
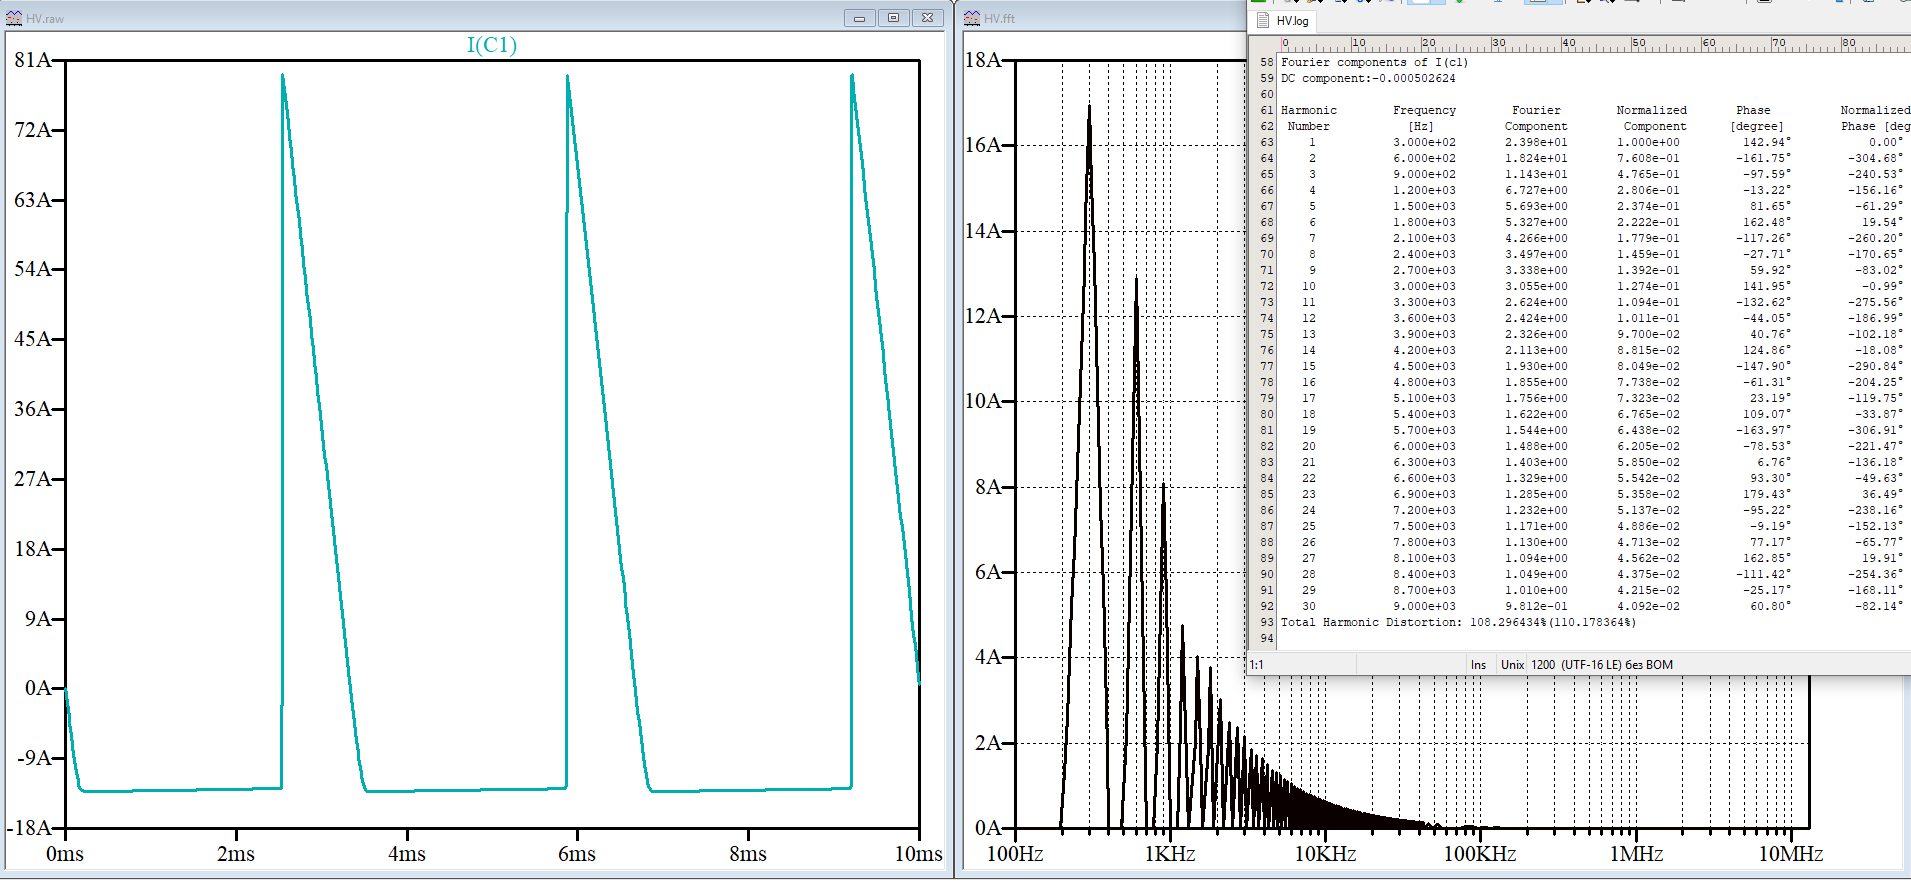
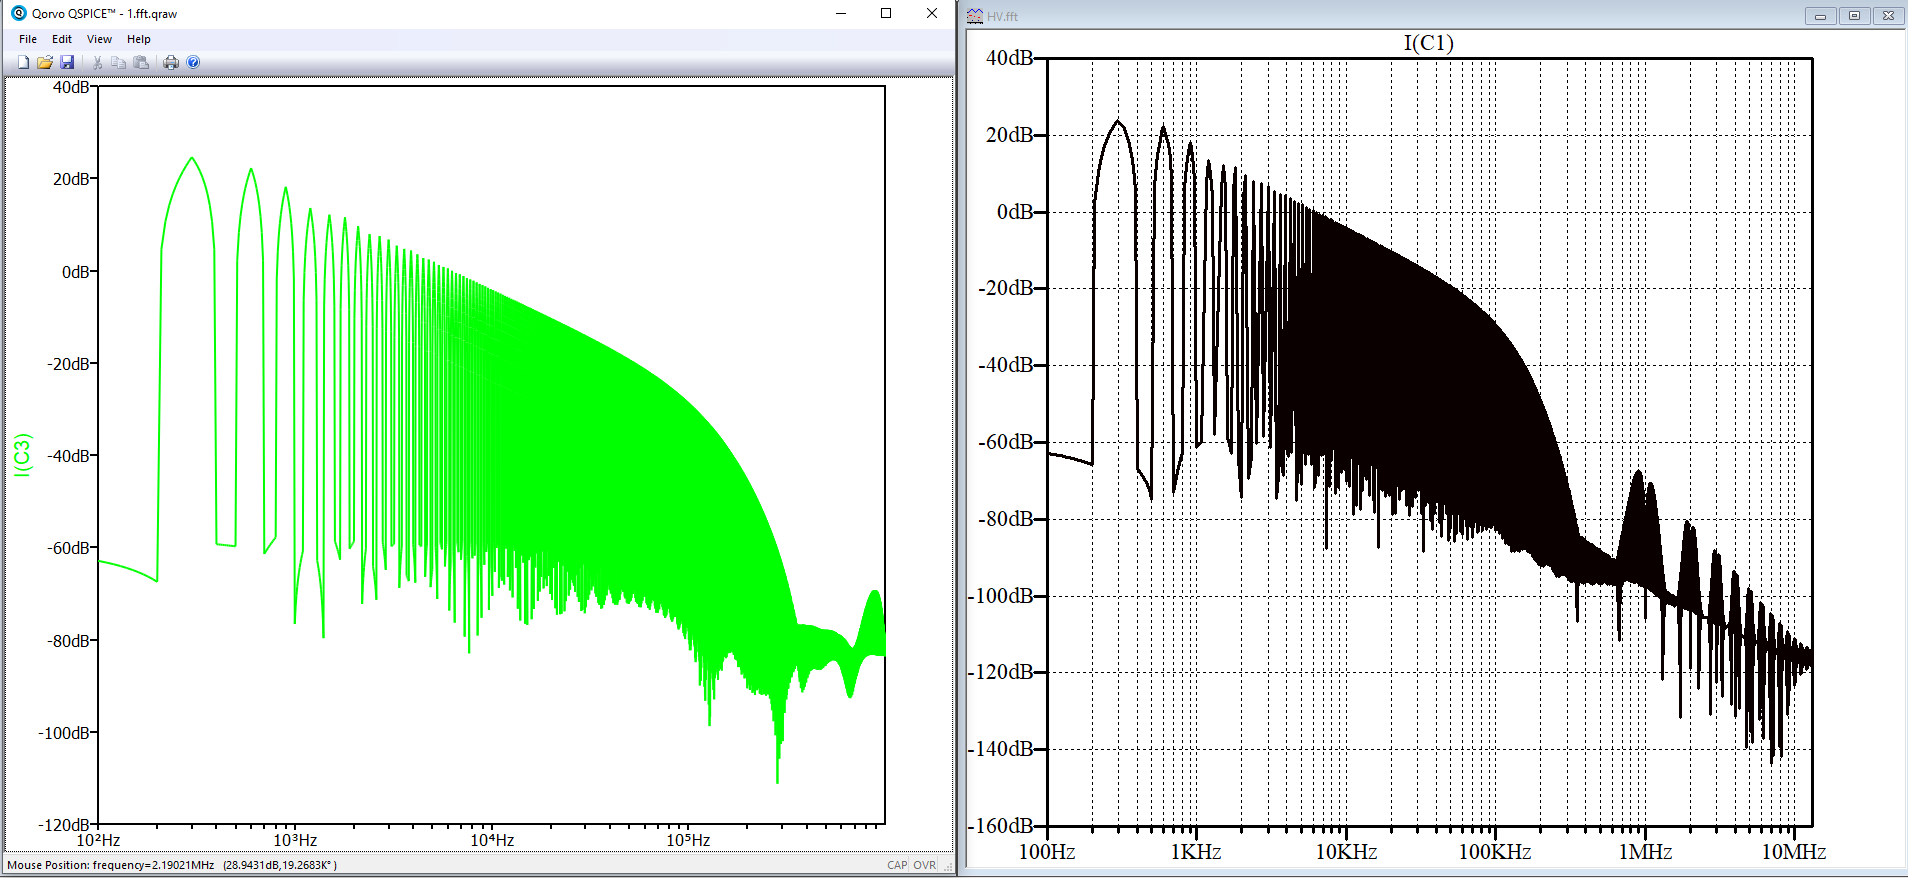
Is there a way to plot .four in those spice program? What that plot look like?
If you ask for FFT, you can do it from waveform windows, right click in waveform windows and select FFT.