Does anyone know, why the Phase plot is once in range from 0 to -100deg when using plot V(out) but in range 0 to +100deg when using plot PHASE(V(out))? Shouldn’t those two be identical?
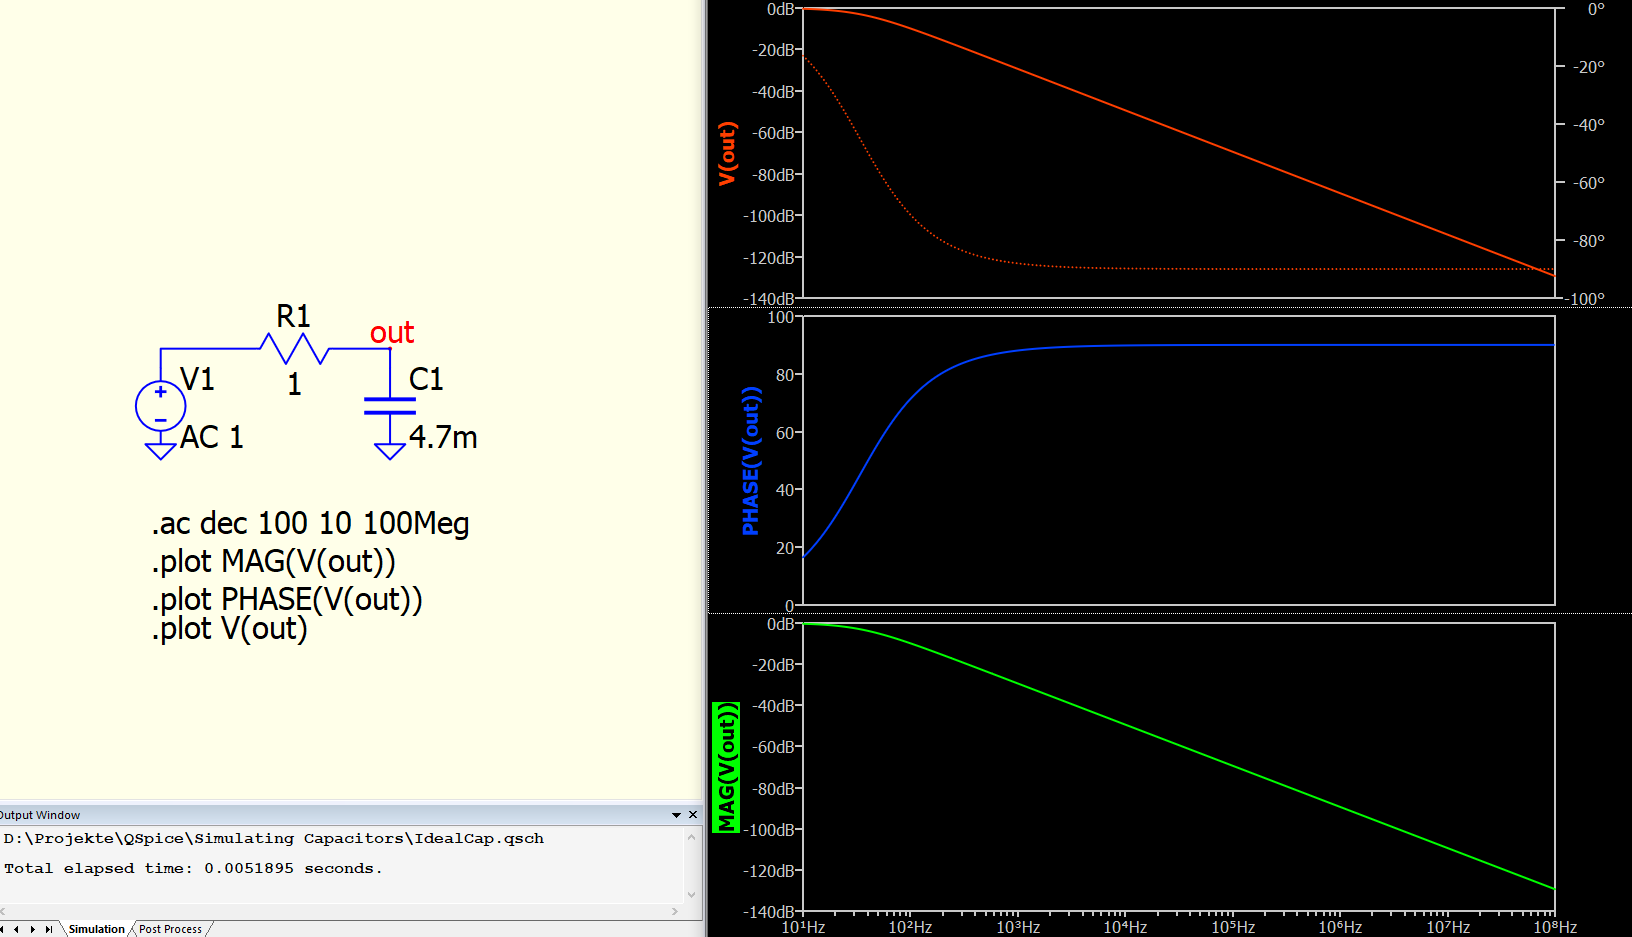
In .ac analysis, data is in complex format. Waveform viewer always plot a complex number with left axis as magnitude and right axis as phase, where it is Bode Representation.
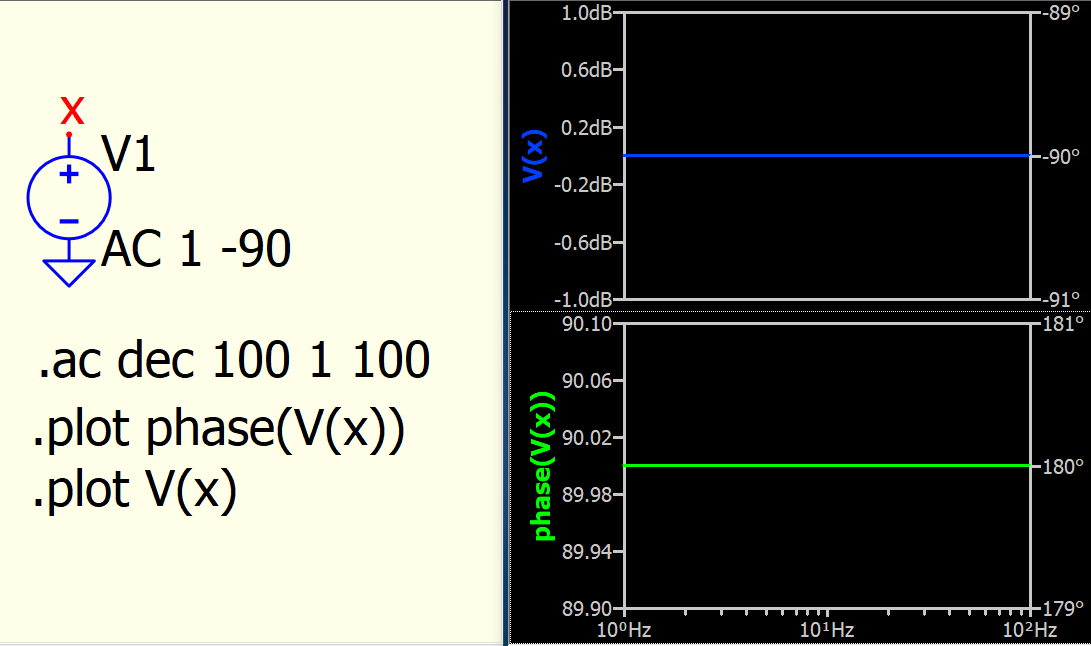
For example, V(x) is Magnitude 1 and Phase -90 degree.
In this case, Phase(V(x)) = -90 = Magnitude 90 and Phase 180 degree
Therefore, when you plot Phase(V(x)) in waveform viewer, you get its Magnitude as 90 and Phase 180.
In short, you cannot get a negative value from left axis with Bode Representation. This can only be solved if waveform viewer can plot with Cartesian Representation, but it is not yet implemented in Qspice.
Work around for your case is simple, add a plot with V(out), not to plot magnitude axis.
2 Likes
Thank you @KSKelvin for this excellent explanation. I now understand the problem.