Simulating conducted emissions for a DC/DC converter, after having the FFT widow and display configuration saved, I felt the need to edit the .pfg file in order to add limit lines.
Does anybody know the syntax?
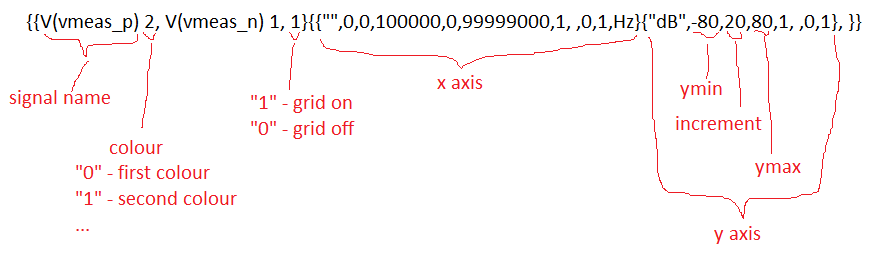
This is what I was able to figure out so far:
…and it seems that everything has to be in one line only for a single plot window. Every new line in .pfg file seems to add a new plot window.
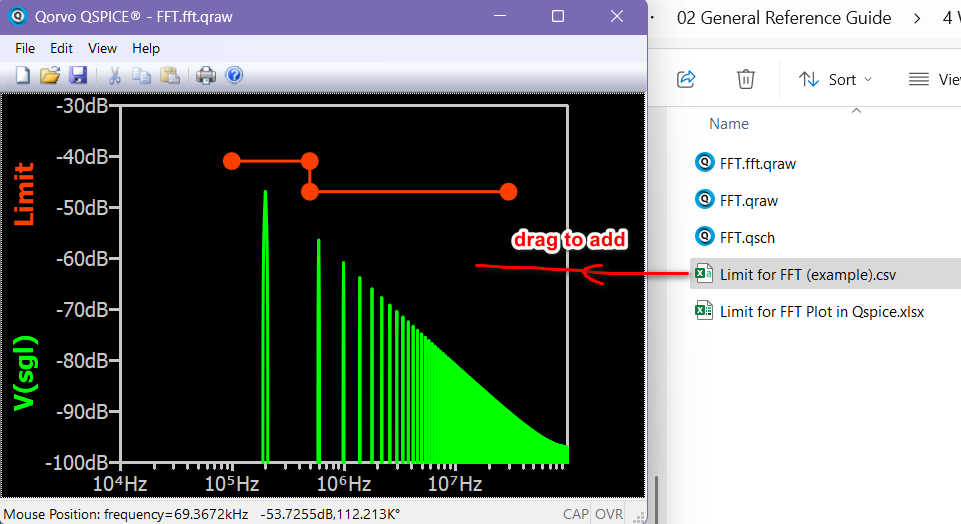
The limit line is data rather than a plot configuration. I think one way to achieve this is to create a CSV file for the limit line. After performing the FFT and creating its waveform window, you can drag this .csv file from the Windows Explorer to the waveform window to add a dataset as a limit line.
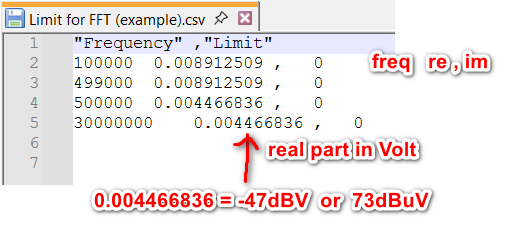
Here is how the CSV is written. As FFT results is a complex number, complex number in Qspice is (re,im), or in CSV : re, im
So, this CSV is Frequency Limit in Volts, 0
In general, standard is dB in volts, and you have to convert it to volts.
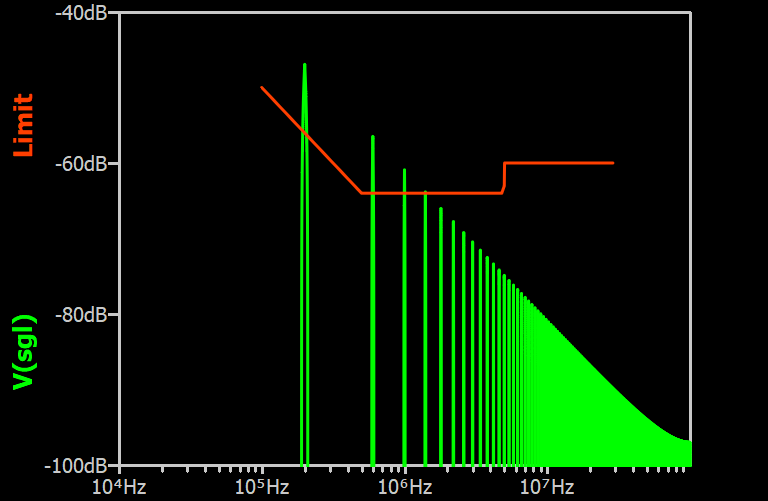
To generate a smooth and linear limit line in dB versus log frequency space, below is a MATLAB code example that can be written directly into a .csv file.
% Define the compliance limit data points: [Frequency(Hz), dBuV]
complianceData = [
     0.100e6, 70;   % 100 kHz, 70 dBµV
     0.500e6, 56;   % 500 kHz, 56 dBµV
     4.999e6, 56;   % 4.999 MHz, 56 dBµV
     5.000e6, 60;   % 5 MHz, 60 dBµV (step change)
    30.000e6, 60    % 30 MHz, 60 dBµV
];

% Store original data points in structure
limitCurve.freqOriginal = complianceData(:,1);  % Original frequency points
limitCurve.dBuVOriginal = complianceData(:,2);  % Original dBµV limit values

% Convert frequency to log space for interpolation
logFreqOriginal = log10(limitCurve.freqOriginal);

% Create finely spaced frequency points for smooth interpolation (log scale)
limitCurve.freqInterp = logspace(log10(limitCurve.freqOriginal(1)), ...
                                log10(limitCurve.freqOriginal(end)), ...
                                1000)';  % 1000 points across frequency range
logFreqInterp = log10(limitCurve.freqInterp);  % Convert to log space for interpolation

% Interpolate dBµV values in log-frequency space (ensures straight lines on log plot)
limitCurve.dBuVInterp = interp1(logFreqOriginal, limitCurve.dBuVOriginal, ...
                               logFreqInterp, 'linear', 'extrap');

% Convert dBµV limits to equivalent voltage (V) using: V = 10^((dBµV - 120)/20)
limitCurve.voltage = 10.^((limitCurve.dBuVInterp - 120)/20);

% Create output CSV file with compliance limit data
fid = fopen('Qspice_FFT_LimitCurve.csv', 'w');
% Write CSV header
fprintf(fid, '"Frequency", "Limit"\n');
% Write data rows with consistent formatting
for i = 1:length(limitCurve.freqInterp)
    fprintf(fid, '%f  %f,0\n', limitCurve.freqInterp(i), limitCurve.voltage(i));
end
fclose(fid);
Hello Kelvin, thank you for your suggestion and for the matlab script! It does exactly what I need.

Florin