I would like to inquire if QSPICE has the capability to display component operating point parameters similar to how LTspice does (as shown in the attached image).
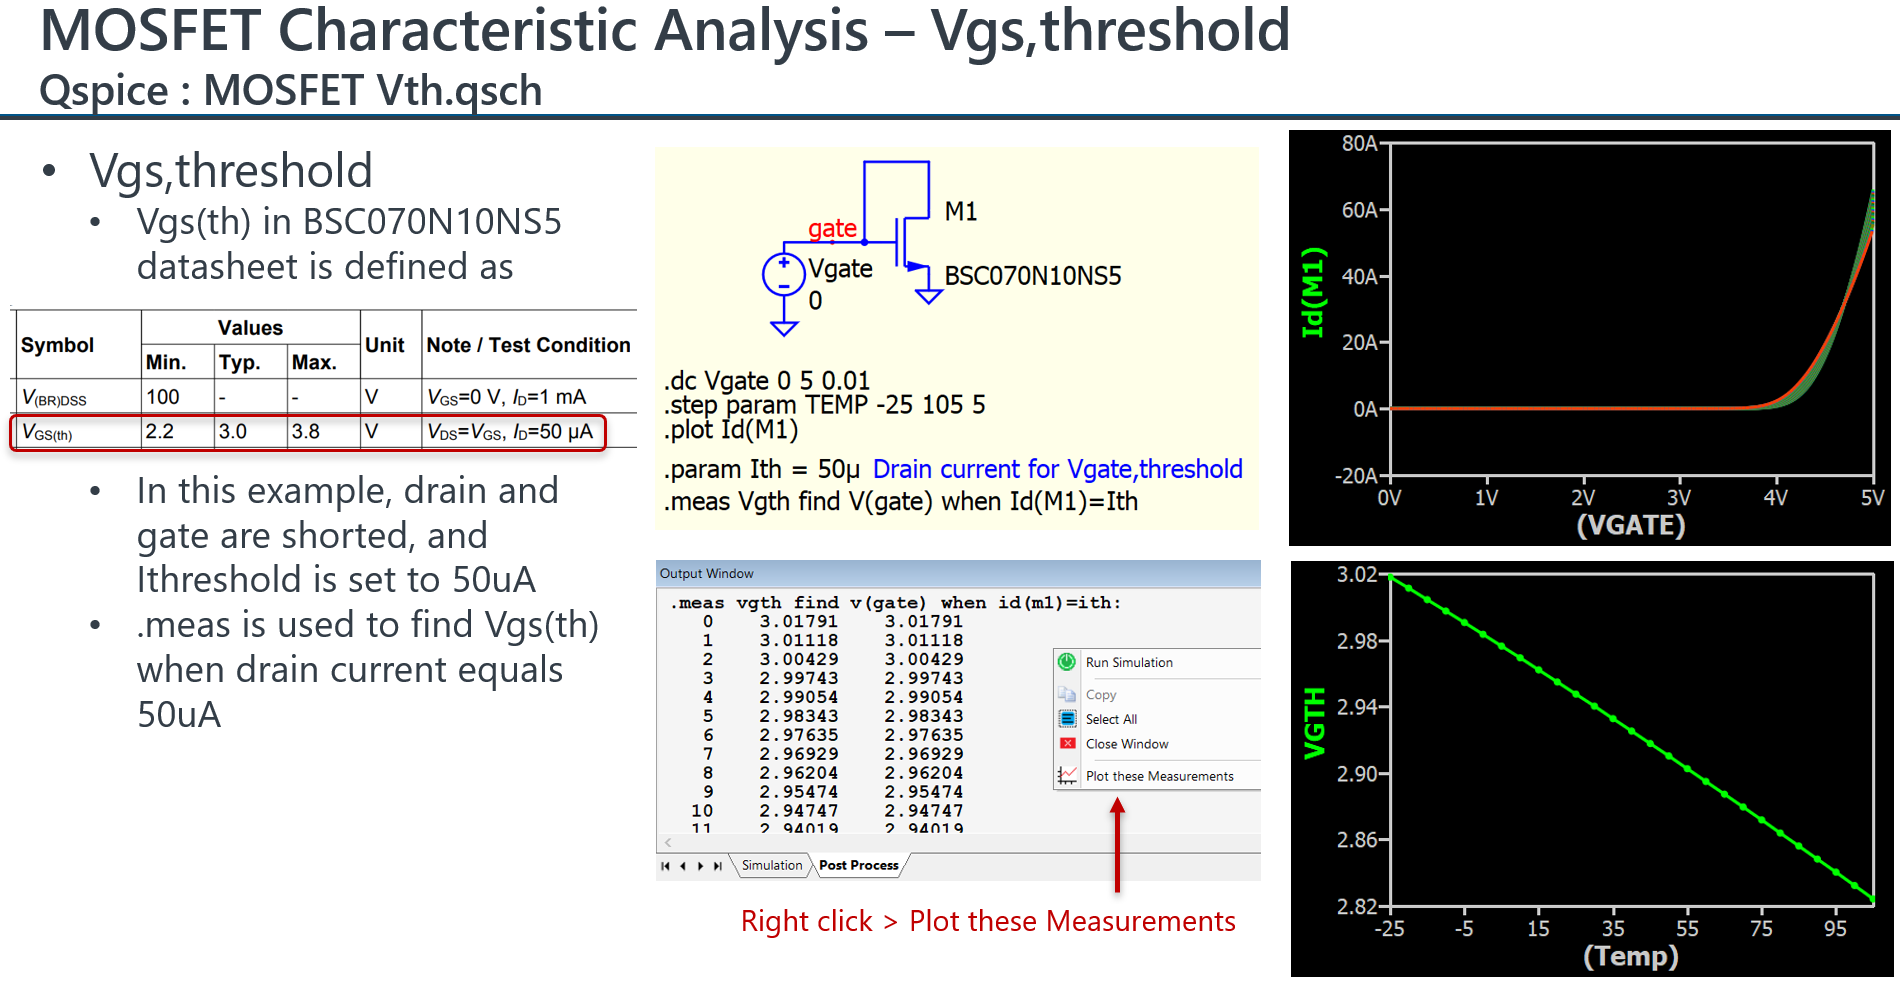
Also, is it possible to plot some of these parameters, e.g., a transistor’s transconductance (gm) or threshold voltage on a variable in DC or STEP analysis?
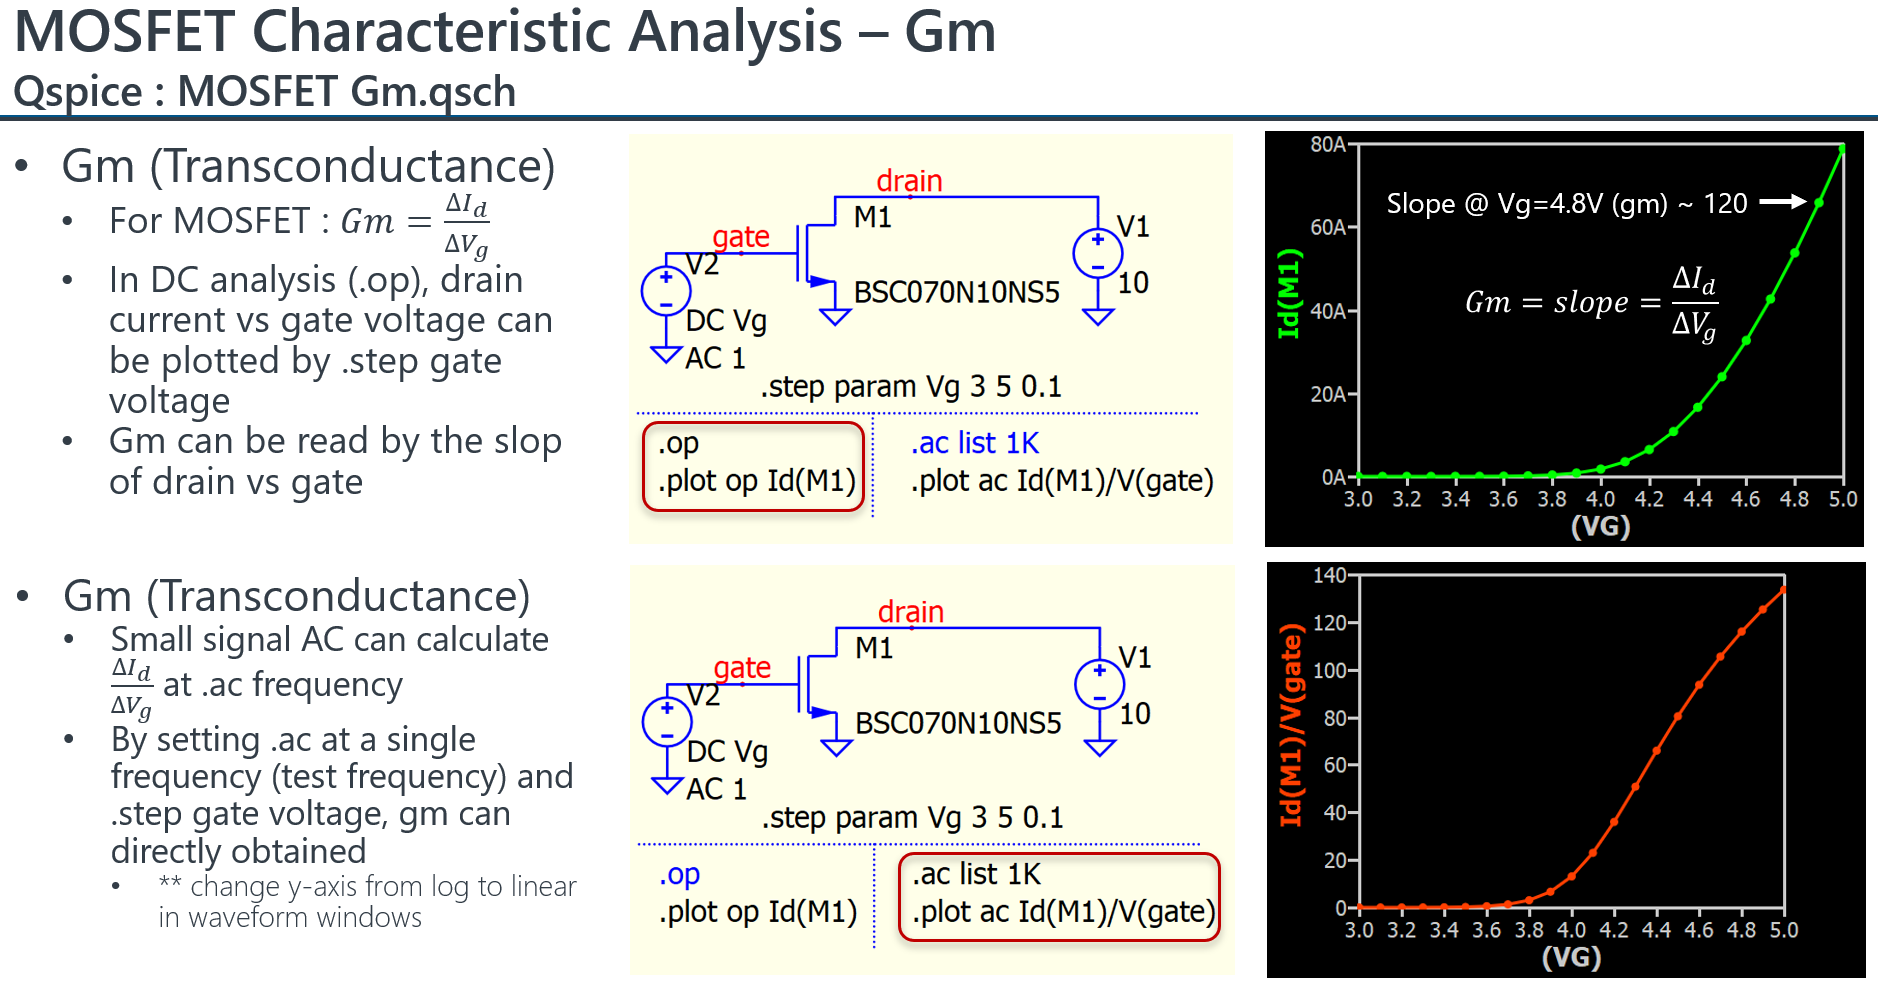
This is an example to get Gm from MOSFET. If you plot drain current vs gate voltage, .op with .step or .dc can both work. As this example also demonstrate the use of .ac, I use .step which can be switch between .op and .ac simulation.
Thank you for your swift response and the guidance provided. I am very satisfied with the information you’ve given. The software appears to be excellent, and I look forward to exploring its capabilities further.
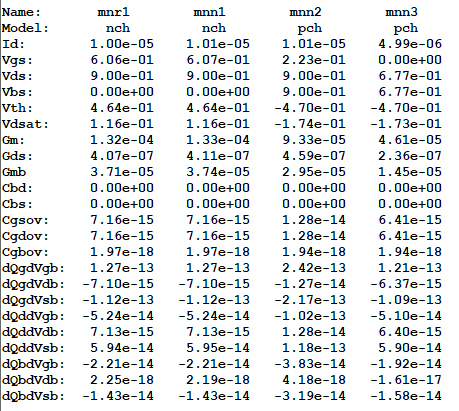
I am interested in using all the transistor small-signal parameters at the simulated operating point in some expressions obtained by hand analysis. My goal is to use QSPICE to verify design guidelines derived by that analysis. While I can have QSPICE calculate, using the measurement setups above, the gm of FETs, I want to know all the FET capacitances, gmb, gds, Vth, and so on. QSPICE must be calculating this internally for .ac analysis. How can they be displayed to the user?
Currently, I need to import my netlist into LTSPICE, as it displays all parameters as shown at the beginning of this thread. This was a built-in feature in Berkeley SPICE.