Hi all. I wonder if it is possible to use the plot command in the schematic to set the time axis of the waveform to another value like a node voltage.
I know I can save the waveform to have an edited time-axis, but is it possible with the .plot command?
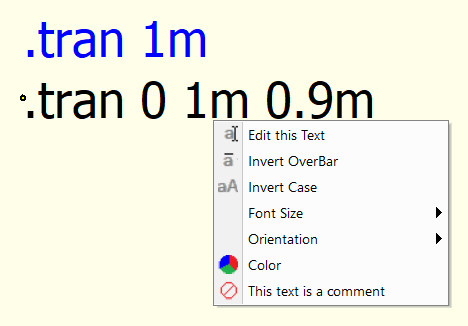
the only way I know is to use traditional berkeley syntax .tran by specify Tstart and Tstop.
a quick method to switch is to setup different .tran and right click to mask inactive one with “This text is a comment”
This is not what I meant I think.
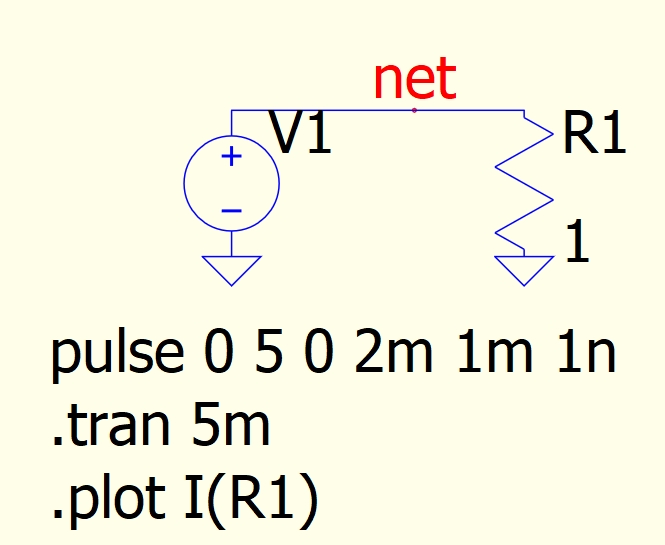
For example I have the below circuit.
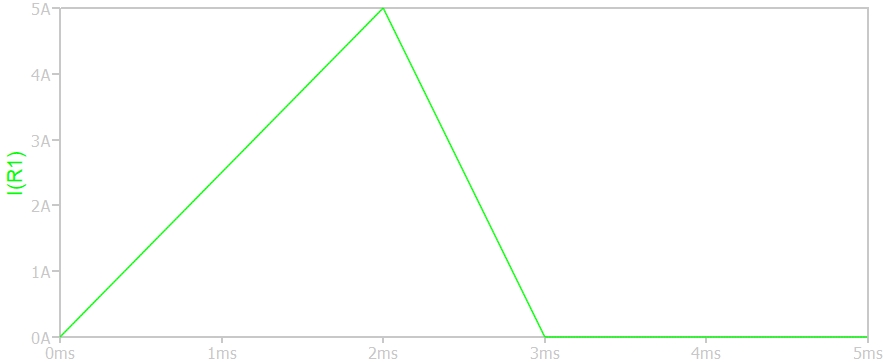
When running I get the below plot, while I want a plot with x axis to be the V(net).
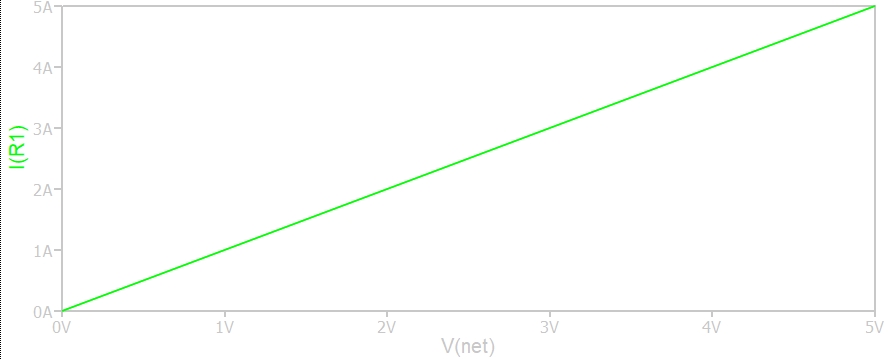
I want the below:
Is it possible to do it from the schematic?
2 Likes