Sometime I use AC analysis to calculate impedance of a node. In Qspice waveform viewer, it seems that I can only plot Log or dB in magnitude and degree in phase. Is there method in waveform viewer can plot in Cartesian representation (linear) for ac analysis? As cartesian representation can read real and imaginary part directly. (an example plot of same simulation with cartesian representation from another spice simulation is also attached)
In addition, for bode plot, can magnitude be plotted in linear instead of Log or dB?
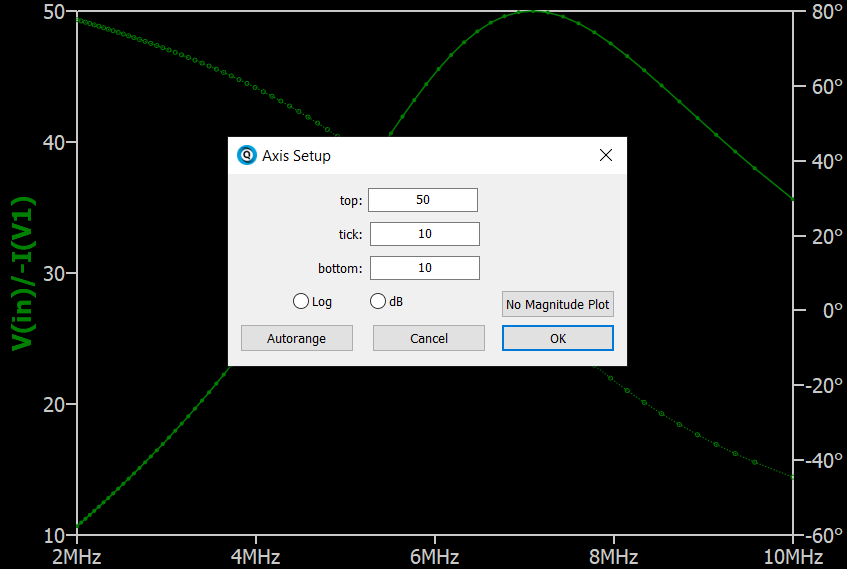
Just realized by deselect Log/dB can give Linear scale.
But still looking Catesian representation to plot real/imag instead of mag/phase.
2 Likes
For the time being, only polar representation is supported, not Cartesian, Nyquist, Smith, Black, or anything else.
But at least it supports parametric polar plotting(writing an equation for the horizontal axis, which I guess gets you close to a Black diagram), and, as you noted, supports, dB, Linear, or Log for the magnitude, the later being useful for plotting voltage dependence capacitances for transistor modeling.
Mike,
Thanks for answering my question! First of all, Qspice is really amazing!
I change horizontal axis from frequency to imaginary part of impedance and can get real/imag readback (but marker cannot move through this trajectory freely and frequency cannot be read with this plot, horizontal axis zoom to fit also not work and must be manually give a range to get the curve display).
But I can get the result by export data and calculate with other software.
Hope you will consider to add other representation in future to eliminate the need of data export for impedance calculation.
1 Like