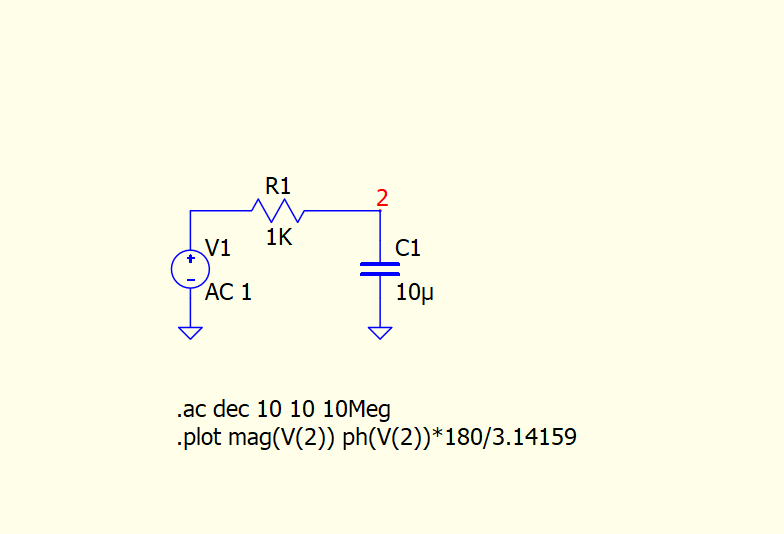
.ac dec 10 10 10Meg
.plot vdb(2) vp(2)*180/3.14159
I want to produce a freq response and phase angle of a low pass filter. Using the expressions above returns ‘syntax error’ for the second line.
If someone can see my error pls suggest a correction.
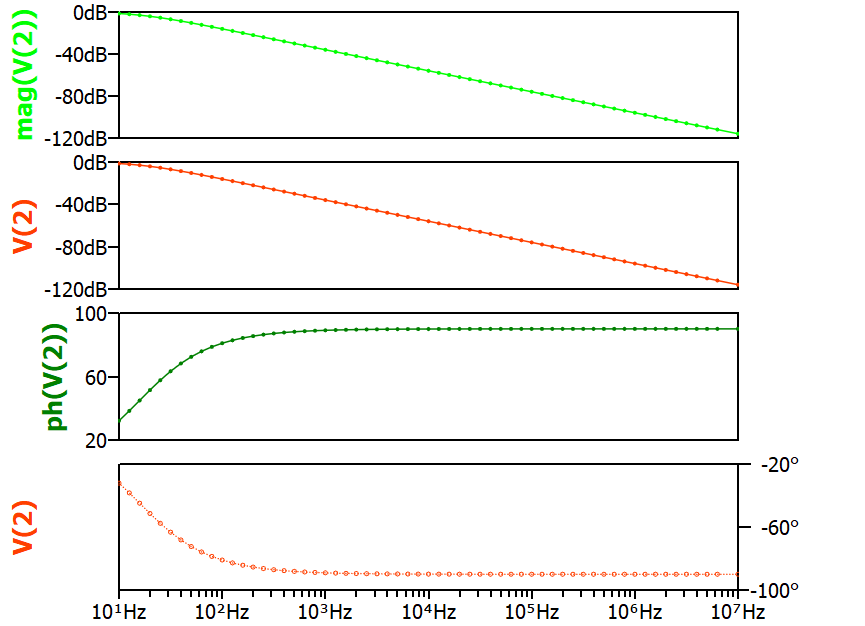
In polar representation plots of complex numbers, the left axis always displays magnitude only, which always +ve. If you display the right axis, you will observe a constant 180 degrees for ph(V(2)).
Complex number calculations always yield complex numbers as results. Polar representation plots show Magnitude/Phase, while Cartesian representation plots show Real/Imaginary components.
Thank you. I had a typo that you helped me see.
Worked for my first Run then fails for subsequent Runs, so wierd!
My update: Works when I add a Label “2” as per your diagram.
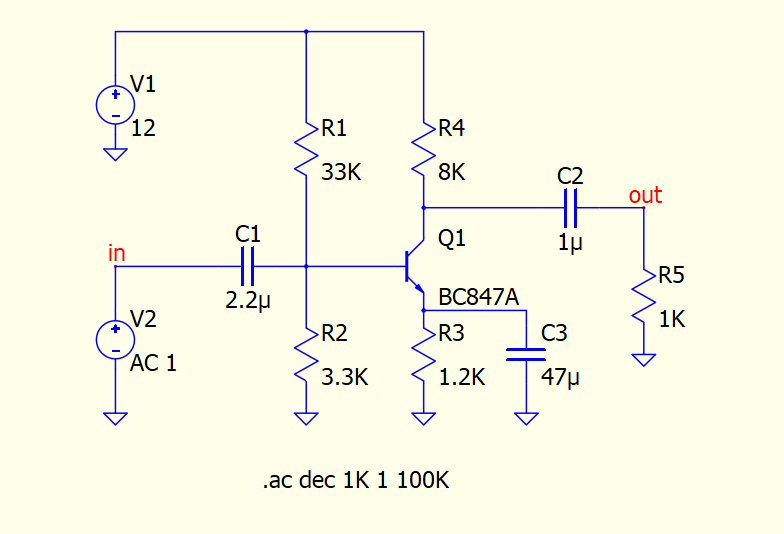
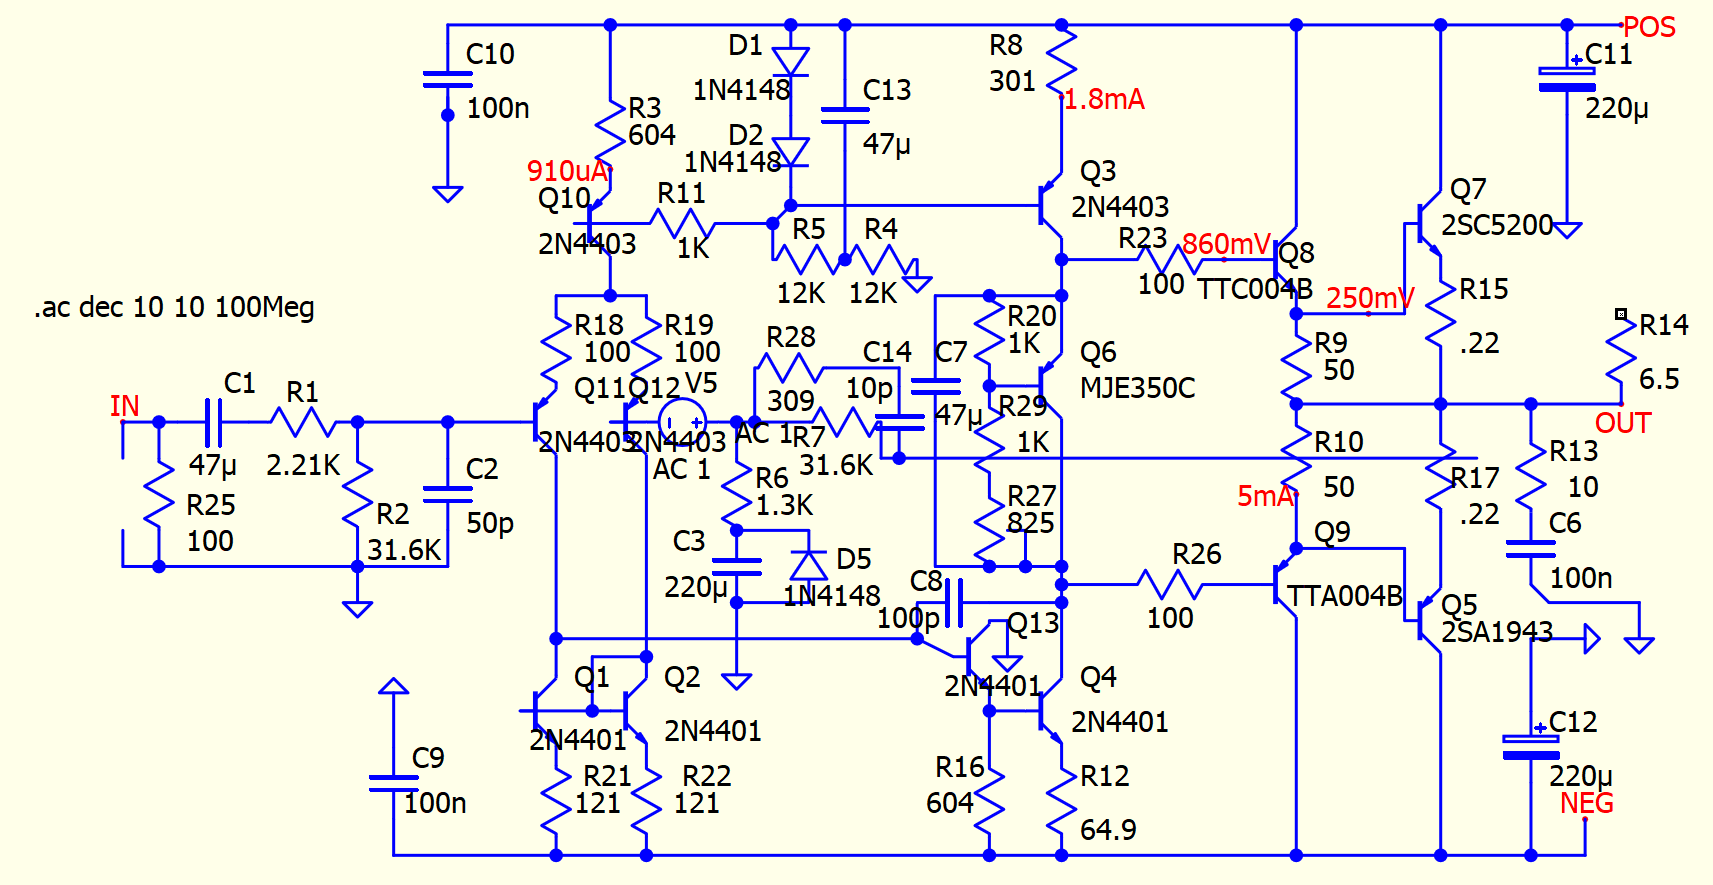
Second question, if I may: I want to check my audio amplifer circuit with a Bode plot. Can you recommend an information source from where I can learn where to place the Label ?
When you need to draw bode plot you dont need to use mag and pha commands. You need only to click on the node of interest. Naming nodes is used only so you can know what trace is what.
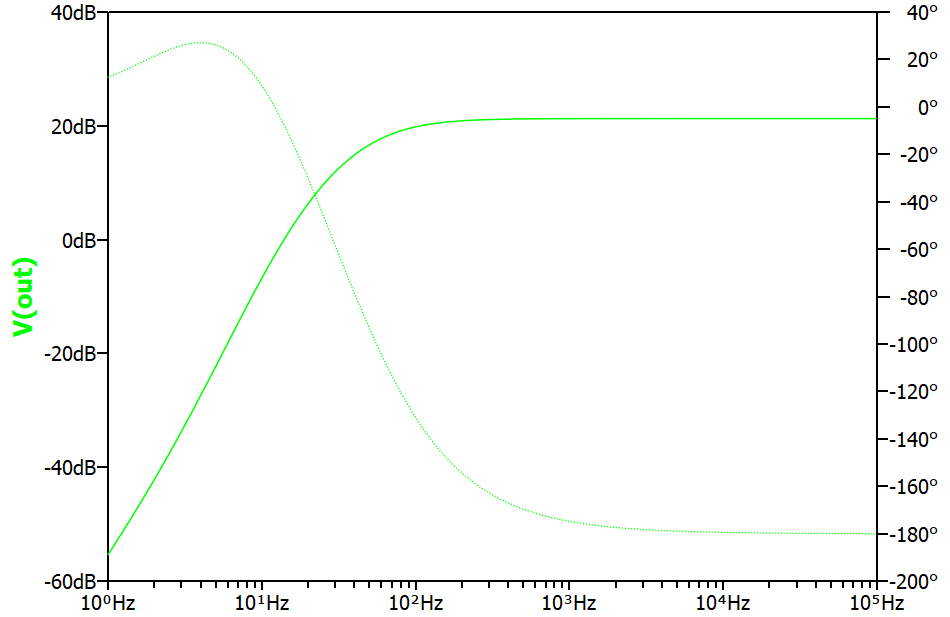
Here out is labeled and when you plot your trace has same name:
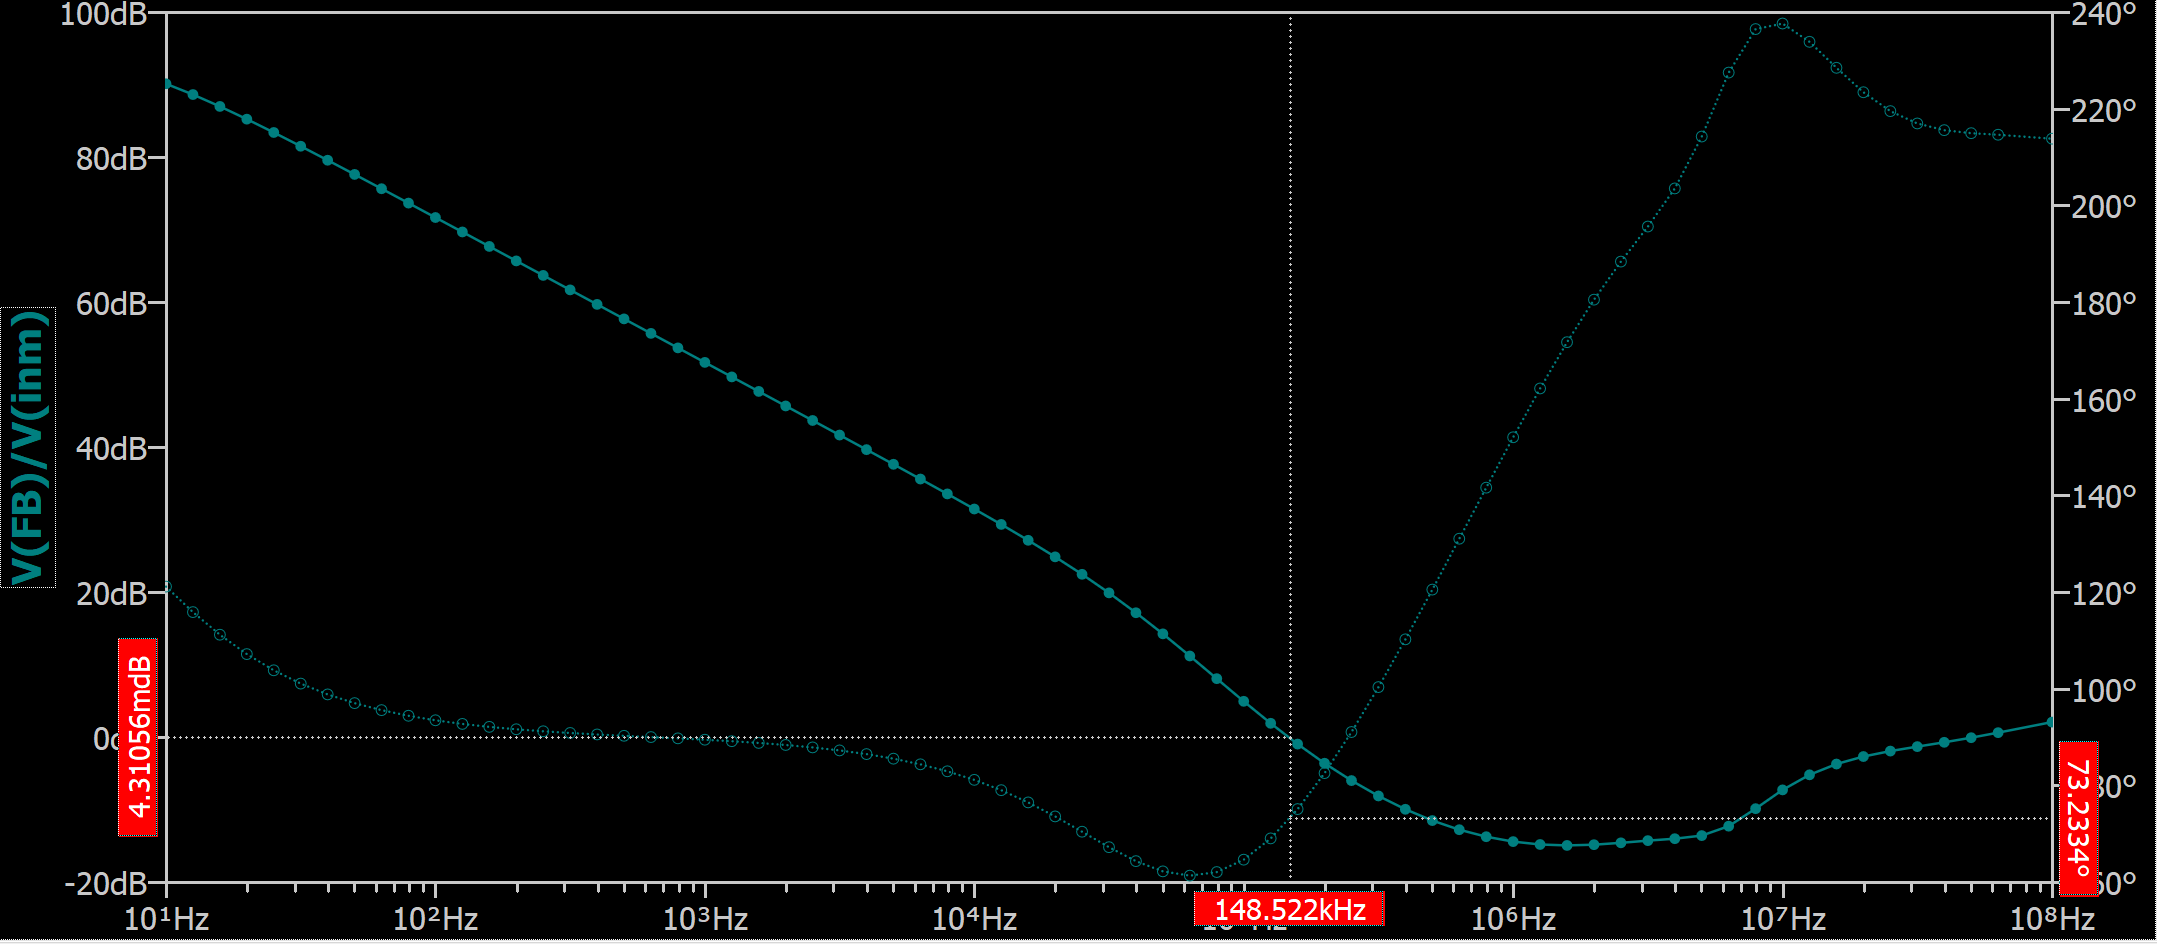
I want to measure the junction at R6 / R7 to plot phase and margin. Using LTSpice jargon I need to plot the expression v(fb)/v(neg_in). QSpice GUI has add Directive / Attribute. Should someone understand what I want to achieve and can explain how to accomplish it, I’d be very thankful.
Thank you for your suggestion to try Demo folder. I frequently have no success here as the Demo folder seems to have nothing in it. I experience this on odd occasions. I don’t know why.
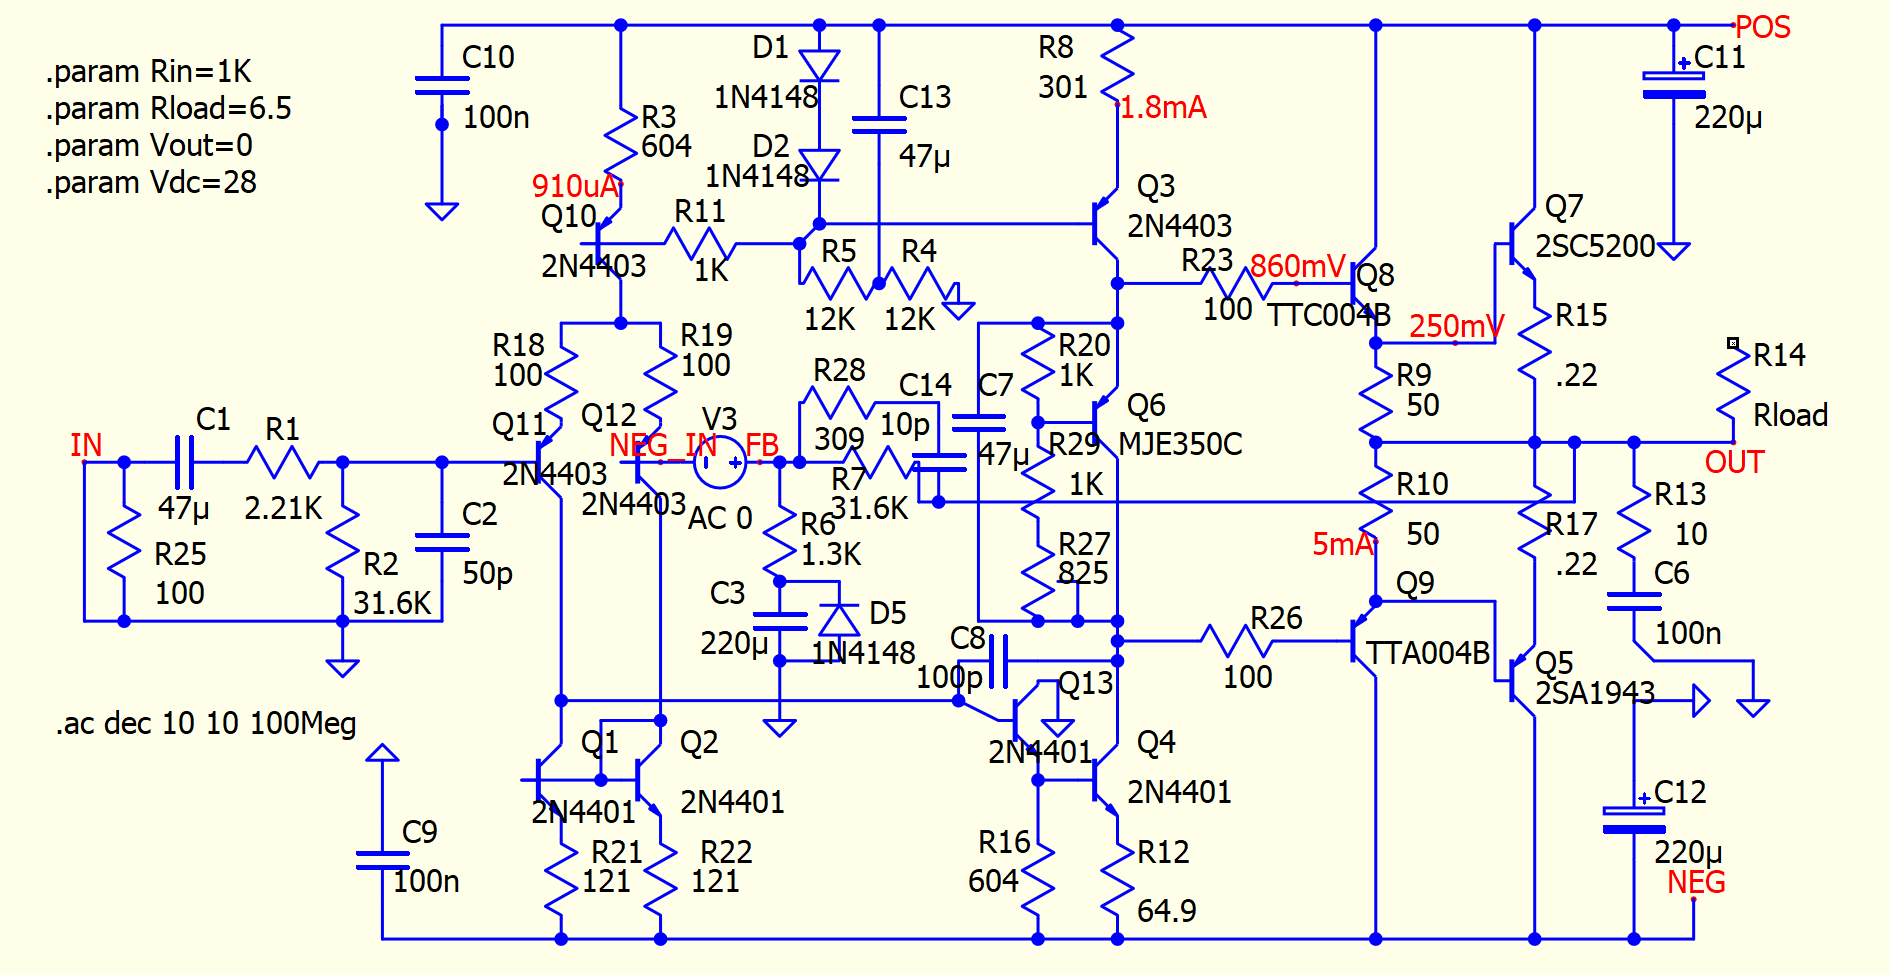
Thank you, this is helpful to learn the Tian method. For now my experience is novice level and to just eyeball the phase margin using a probe to measure fits my scope of knowledge. By placing the AC source at the LTP neg input with NEG-IN and FB labels either side, can I use expression or functions to allow measuring and what would these be?
Thank you again. I have discovered that I can right click on the output window and add the expression V(FB)/V(NEG_IN) either side of the voltage source. This lets me trace the plot I wanted.