@frank.wiedmann I did consider this method but so far not possible to get Im(S11()) to display a negative number. I guess the reason is that waveform viewer always plot .ac result (imaginary number format) with its magnitude and phase, where magnitude is always with abs() operator. Here is what I get if to setup a plot with x-y scatter.

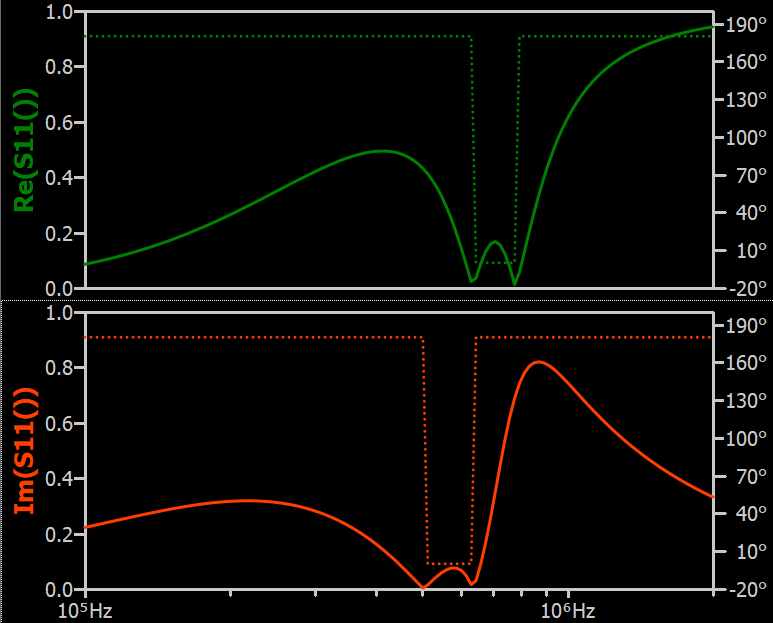
If I put the plot against frequency, we determine whether this Re() or Im() value is positive or negative from phase (0 degree or 180 degree).
So far, I cannot find a way in waveform viewer can display a negative value. I hope one day when Mike has time can give Cartesian representation, which may be the best way to deal with this type of plot.